
Bitcoin Above $50,000. Ethereum Breakout to $4,000!
Bitcoin Above $50,000. Ethereum Breakout to $4,000!
Bitcoin & Altcoin Weekly Insights (6th September 2021)

Bitcoin
Bitcoin has made a clean break above $50,000, an area which could play a pivotal role in deciding whether the larger scale Crypto Bull run will continue. Take a look at the chart below.
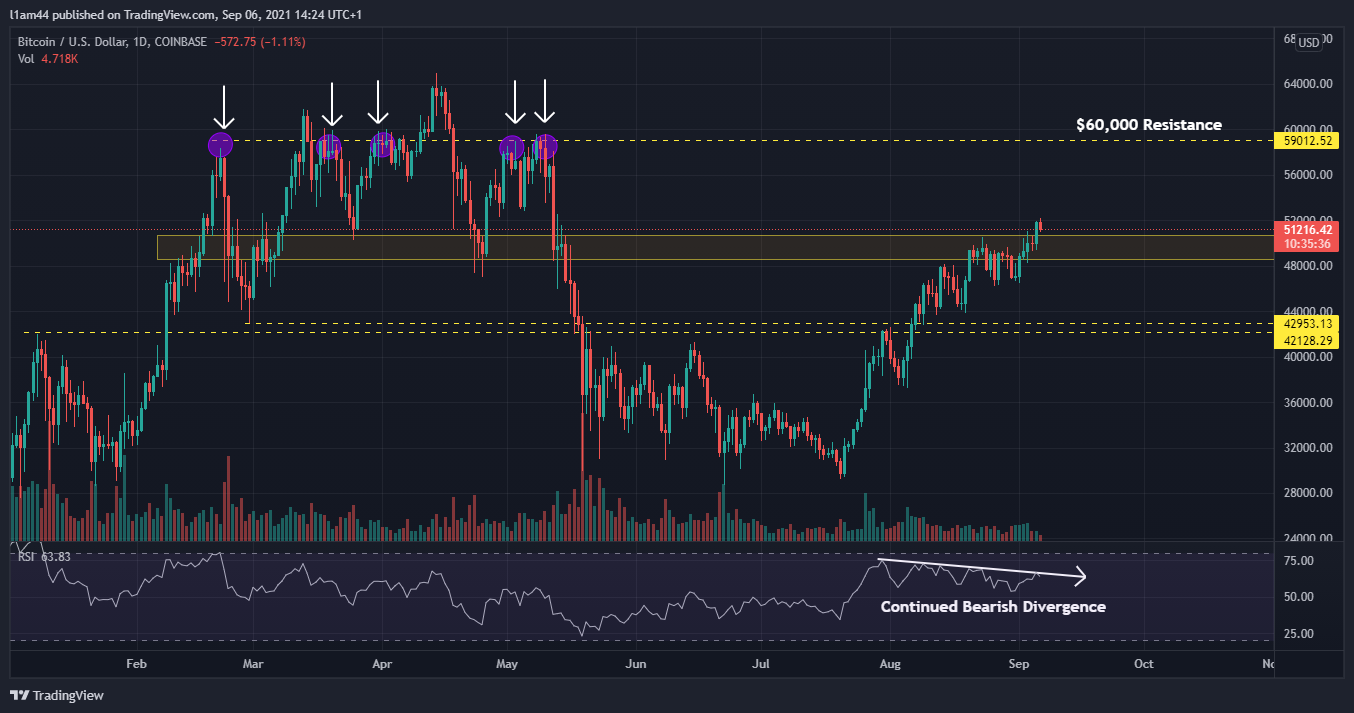
We discussed, in the previous edition of this newsletter, that $50,000 could be a significant level, especially if we cannot close above it. Bitcoin has had a strong rally with very little in the way of bearish price action.
Nothing has changed here in terms of the market structure - except Bitcoin is now above the $50,000 level. Should it remain here, without falling back below, I would expect a test of the next significant resistance level around $60,000 - shown on the chart above. This is the scenario I am expecting to play out, but as always, it is never a sure thing.
To be more precise, this level comes in at $59,000, just shy of the ‘Big Even’ level of $60,000. Here it is reasonable to define the resistance level as $60,000 rather than $59,000, simply due to the psychology of a big even level so close to the previous all-time high.
Resistance came in at this level 5 different times as we formed the top prior to the May crash. We can see, on the two occasions we broke above this resistance, we did not remain above for long.
On the other side of things, should Bitcoin fall back below the resistance band (around $50,000-$48,000), and is unable to break back above this level, then I would expect a retest of the crucial support level around $43,000-$42,000. I remain bullish on a return to all-time highs, should this support level hold.
One looming negative around current price action, is that the RSI continues to create bearish divergences, with higher highs in price coming with lower lows on the Relative Strength Index. The ideal situation here is that Bitcoin has a strong rally towards $60,000 whilst simultaneously creating a higher high on the RSI as well as in price - thus invalidating the previous divergences.
Remember, bearish divergence, in of itself, is not enough to expect a bearish move, especially with price just above the resistance level (potentially now support) defined in the previous newsletter. More confluence may be needed in order to expect such bearish price action.
One particular dynamic that has changed since the previous newsletter is Miner Inventories. I previously highlighted the correlation between Miner selling and price corrections (for the last 5 weeks). Since, we have seen a complete detachment of this correlation.

As we can see miner selling has increased dramatically over the last week (plotted in green). Meanwhile, the price of Bitcoin continues to rise. I am told that this is indicative of strong market.
Buyers are able to absorb the increased selling pressure of miners, and not only that, but also push the price higher as well, during this time of increased sell pressure. Take what you will from this information, but personally, I see this as supportive of my thesis - that we will revisit $60,000, should prices remain above $50,000.
Once again I recommend checking out the on-chain data, provided by ByteTree for yourself
Ethereum
Now, it is worth a mention here, we have also had some developments since the previous newsletter regarding Ethereum. Previously, we defined the squeeze occurring on Ethereum, caused by a reduction in volatility. This squeeze meant that Ethereum was likely to experience a breakout, with the most likely direction being a break-out higher. This was due to the support level of $2900 which Ethereum was consolidating above.
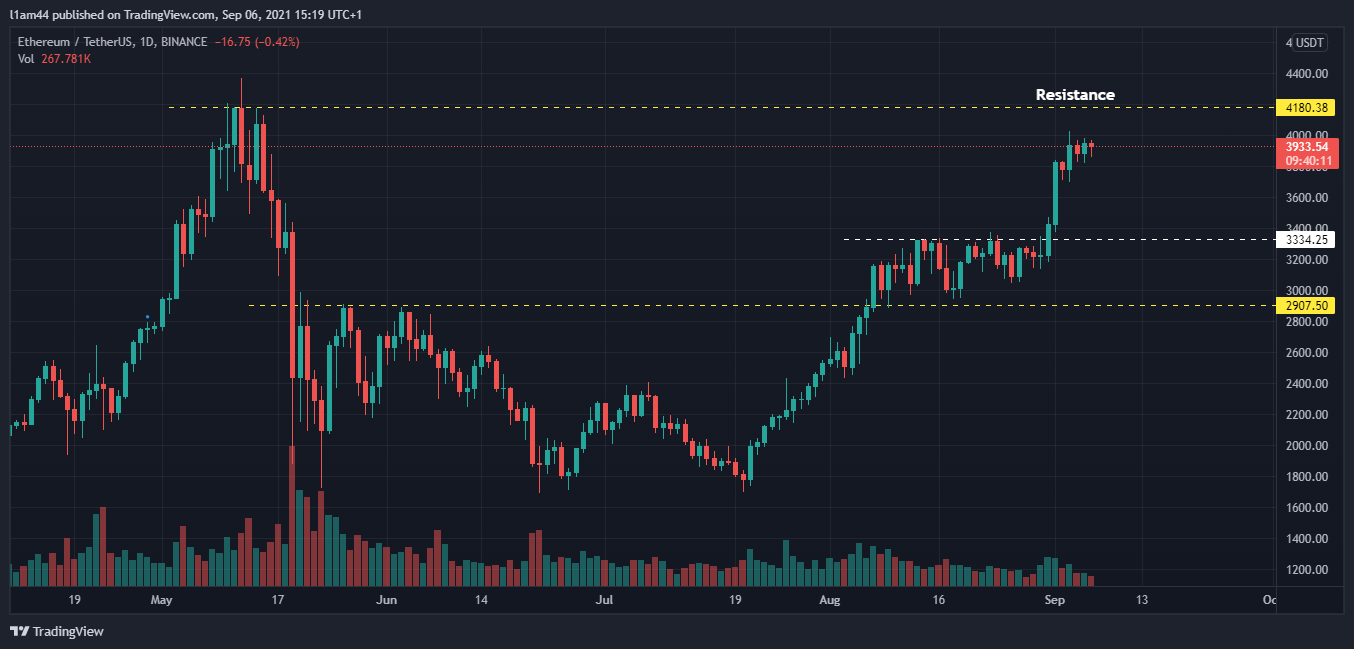
We can see that Ethereum successful broke above the resistance level at $3330. Subsequently, price has risen to just over $4,000 before experiencing a minor cool off. This is in line with our first take profit zone on the trade setup from the previous newsletter.
I thought it would be worth mentioning that Ethereum is no longer an entry opportunity in my opinion. We can see from the above chart, that this move has taken us to just a few hundred dollars below the resistance level, close to the previous all-time high.
If I were looking for an entry on Ethereum, I would be waiting for a cool off.
Bitcoin Dominance
Whilst the market remains bullish, I wanted to bring your attention to a chart analysed within this newsletter on August 16th.
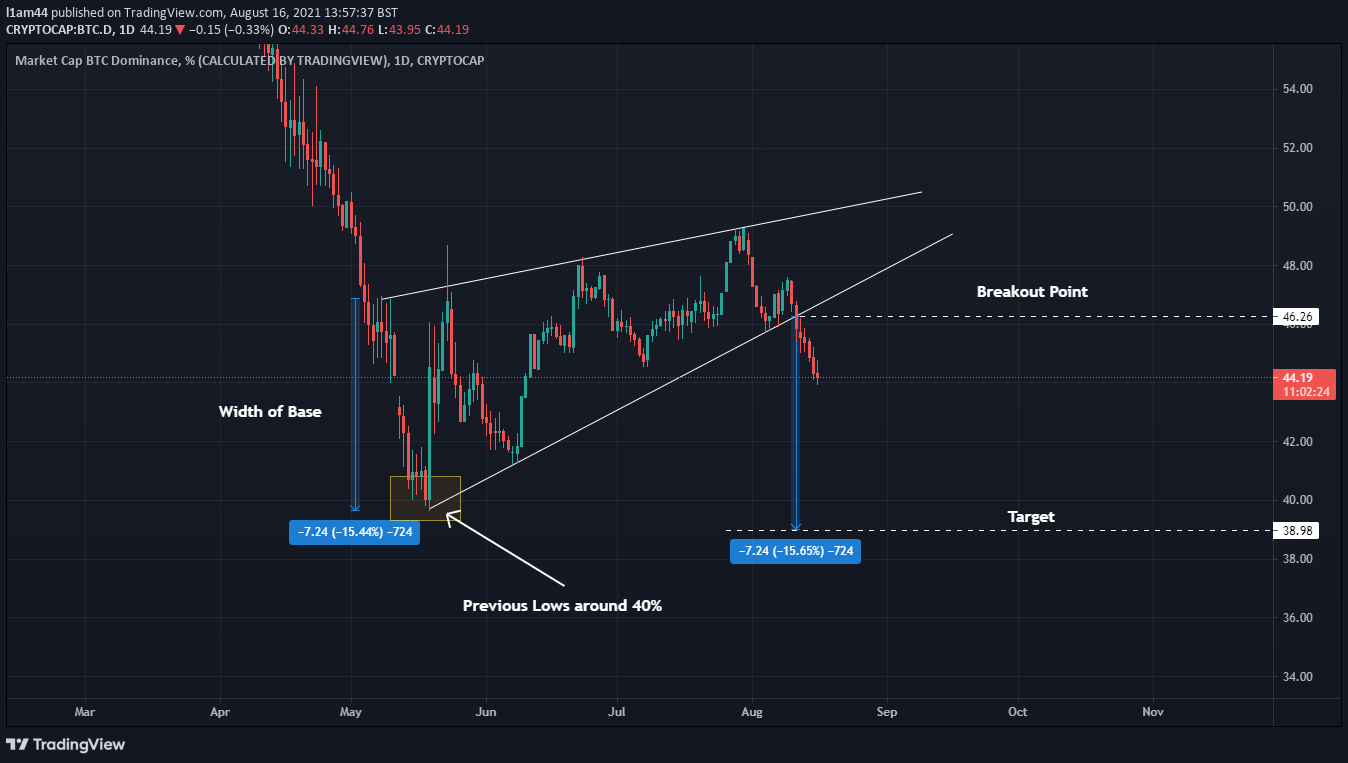
As discussed previously, we can see that Bitcoin Dominance had broken down out of a rising wedge. Putting a measured move target close to the previous lows around 40% dominance.
Fast-forward to today, and the chart we get is this.
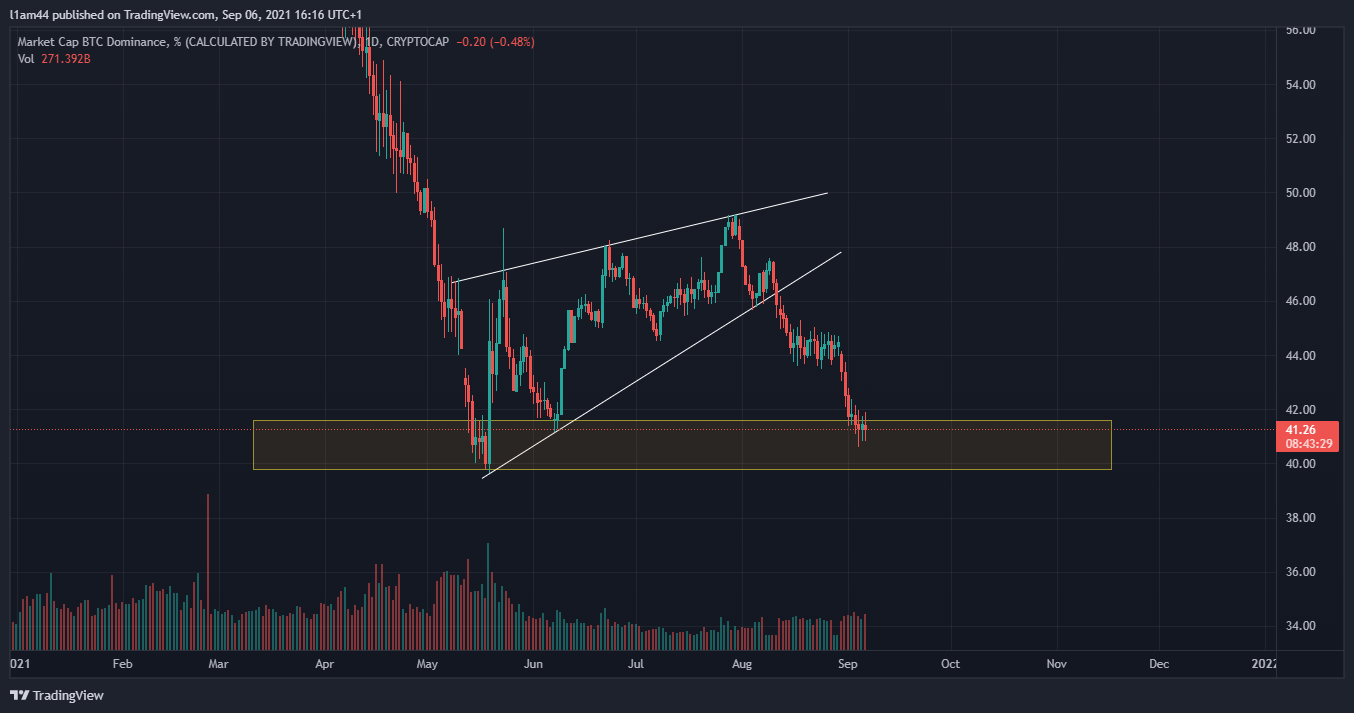
The expected move, after breaking down from the rising wedge pattern, has taken place, and now we have to focus on the area close to 40% dominance.
The situation here is that this is a logical place to see a reversal in dominance, meaning that sometime soon, Bitcoin may begin to outperform Altcoins, at least for the short term (if nothing else).
Whilst I remain bullish on Altcoins, this chart emphasises that perhaps an entry at current levels of dominance, as well as current price levels (such as with the Ethereum chart above), may not be the most optimal.
I have the luxury of having purchased during the lows of May and June, in many cases, but some reading may not be so lucky. Just consider that, at some point, we may see a sizable correction and this could be your opportunity to enter.
Regarding the current chart, should we continue to break below the lows of 40% for Bitcoin Dominance, I would expect a larger scale Altcoin season to occur.
Litecoin
Lastly, in this week’s Newsletter, I’d like to talk about Litecoin again.
From a technical perspective, Litecoin has some very easy on the eye chart setups. This is ideal for someone who takes a technical approach to markets. I continue to believe in the long term setup for Litecoin, with a power move potentially occurring, should Litecoin break out of a falling wedge pattern on the Monthly chart. (A reminder of that chart here).
I recently took a trade on Litecoin - I purchased this using some of my Bitcoin holdings. I took an entry at 0.003709 (370,900 Satoshis), with the intention off closing the position as we close in on 0.005, or 0.007. (500,000 and 700,000 Satoshis respectively)
The reason for this entry was simple, Litecoin had successfully broken out of a falling wedge on the Daily timeframe - see the chart below.
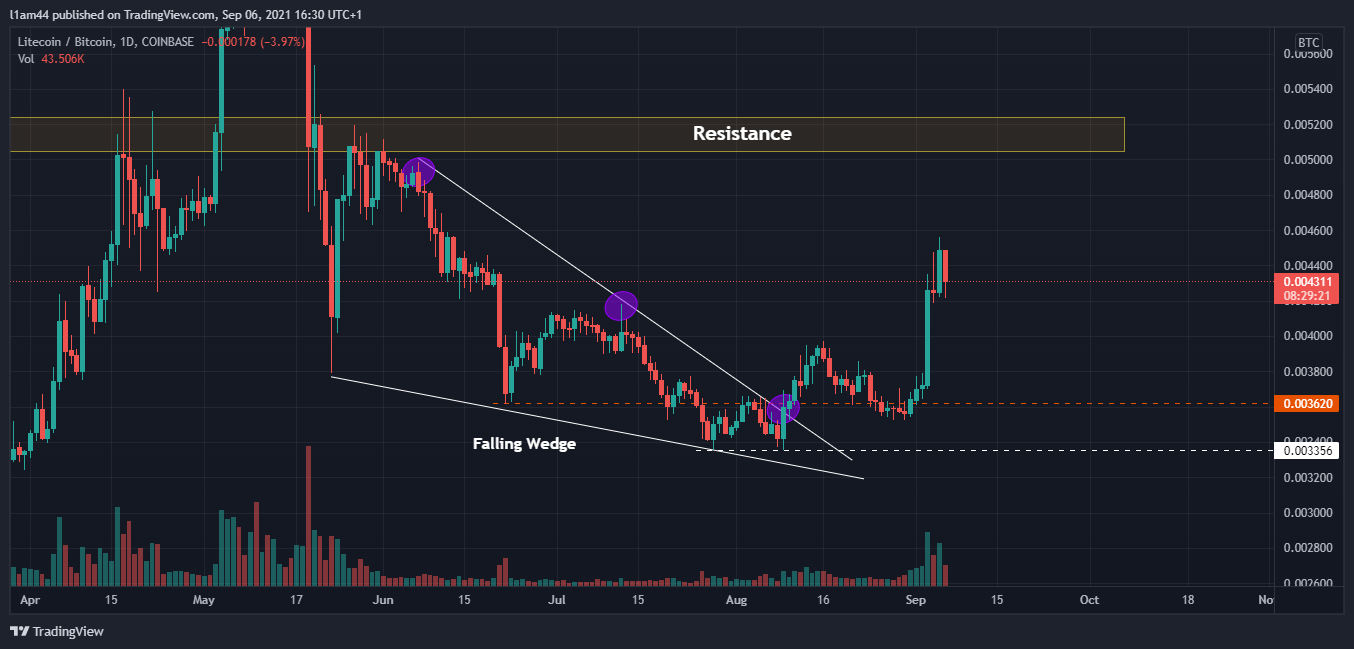
We can clearly see the breakout for Litecoin, above the descending resistance line, which creates the upper boundary of this wedge formation.
This is retrospective analysis. Now, what we can see is that Litecoin is fulfilling it’s expected potential having broken out of the wedge, almost reaching 0.004600. I believe this is a temporary pause and that we will see continuation towards 0.005000.
If you had not entered a position already, you are undoubtedly late to the party. However, there could be an opportunity for a trade setup, should you see a reasonable pullback from Litecoin towards the level of 0.004000.
What is very important about this chart structure, is that Litecoin is creating higher highs and higher lows for the first time since the May crash. This is indicative of a trend reversal, from a downward trend - with lower highs and lower lows, to an uptrend - with higher highs and higher lows.
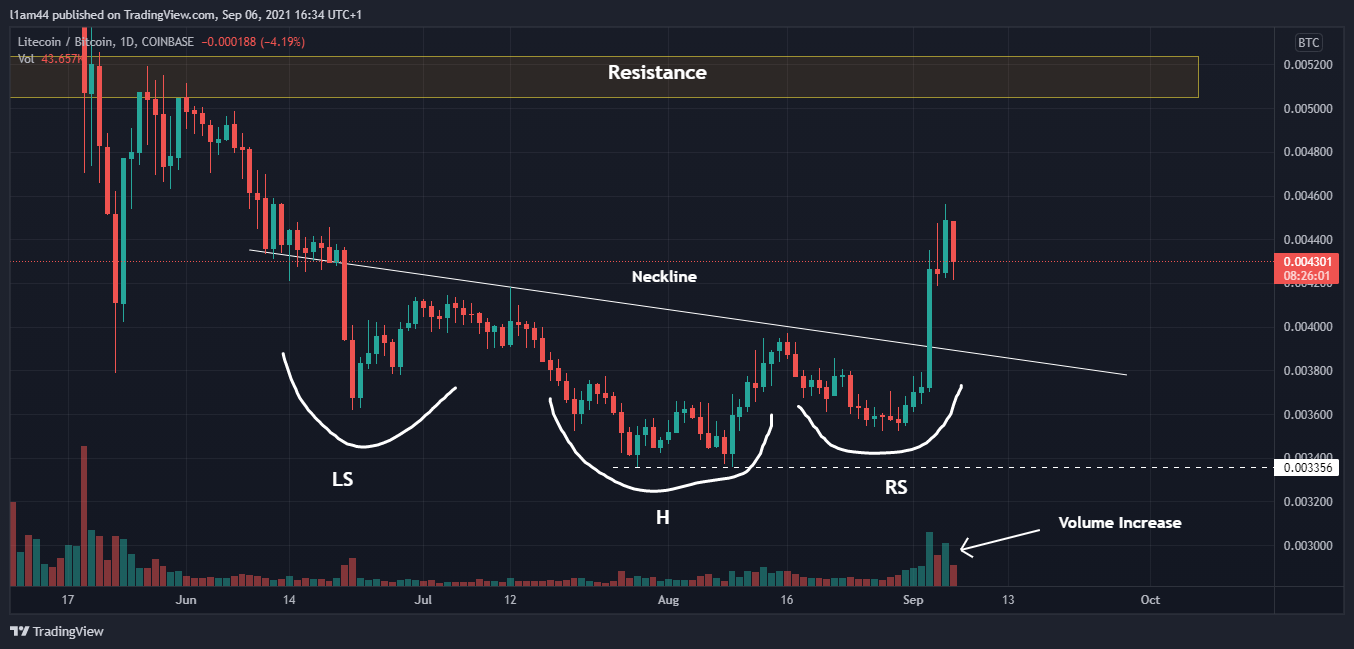
To support the idea that this is a genuine breakout and bullish move, the above chart shows another reversal pattern known as an Inverse Head and Shoulders. This pattern forms at the bottom of a downtrend and consists of three different lows. The first low is the left shoulder (LS), the second low the head (H), and the third low the right shoulder (RS).
Connecting the highs in between these lows is, what is called, the neckline. A break of the neckline indicates a bullish move, and this is what took place on the LTC/BTC chart above.
One might expect prices to come back towards the neckline, to retest the neckline (previous resistance) as support. This could present an opportunity for an entry on Litecoin, should prices return towards 0.004000.
To back up the fact that this is a genuine break, we can also see from the volume bars, that the break above the neckline also came with an increase in volume activity - something you want to see in the event of a bullish price reversal.
This concludes this week’s edition of the Confident Report.
If you found this newsletter valuable, please do consider spreading the word to others.
For those of you on a Monthly subscription, consider upgrading to an annual plan whilst the 40% discount is on offer here:
Thanks for reading, and until next week, take care.