Bitcoin & Altcoin Weekly Update (9th Aug 2021)
Bitcoin Moves Above Key Resistance - Are Altcoins Now Poised To Break Out Higher?

This is the 3rd Edition of the Bitcoin & Altcoin Analysis Newsletter - the Confident Report
In today’s edition, we will be focusing on the altcoin market and whether the recent, key breakout from Bitcoin can set altcoins up for a significant rally in the near future.
To refresh your memory on Bitcoin Dominance and the Altcoin Season Index, feel free to refer back to the previous edition here:
In the previous edition of this newsletter we took a look at;
A) Bitcoin, which still had some work to do to break out above key resistance. ($43,000-$42,000)
B) Ways to measure Altcoin market momentum using Bitcoin Dominance & Altcoin Season Index
Now then…
Thesis For A Bullish Period For Altcoins - Bitcoin Strength Is The Key
Allow me to begin with an explanation of my thesis for an Altcoin rally after the recent Bitcoin breakout.
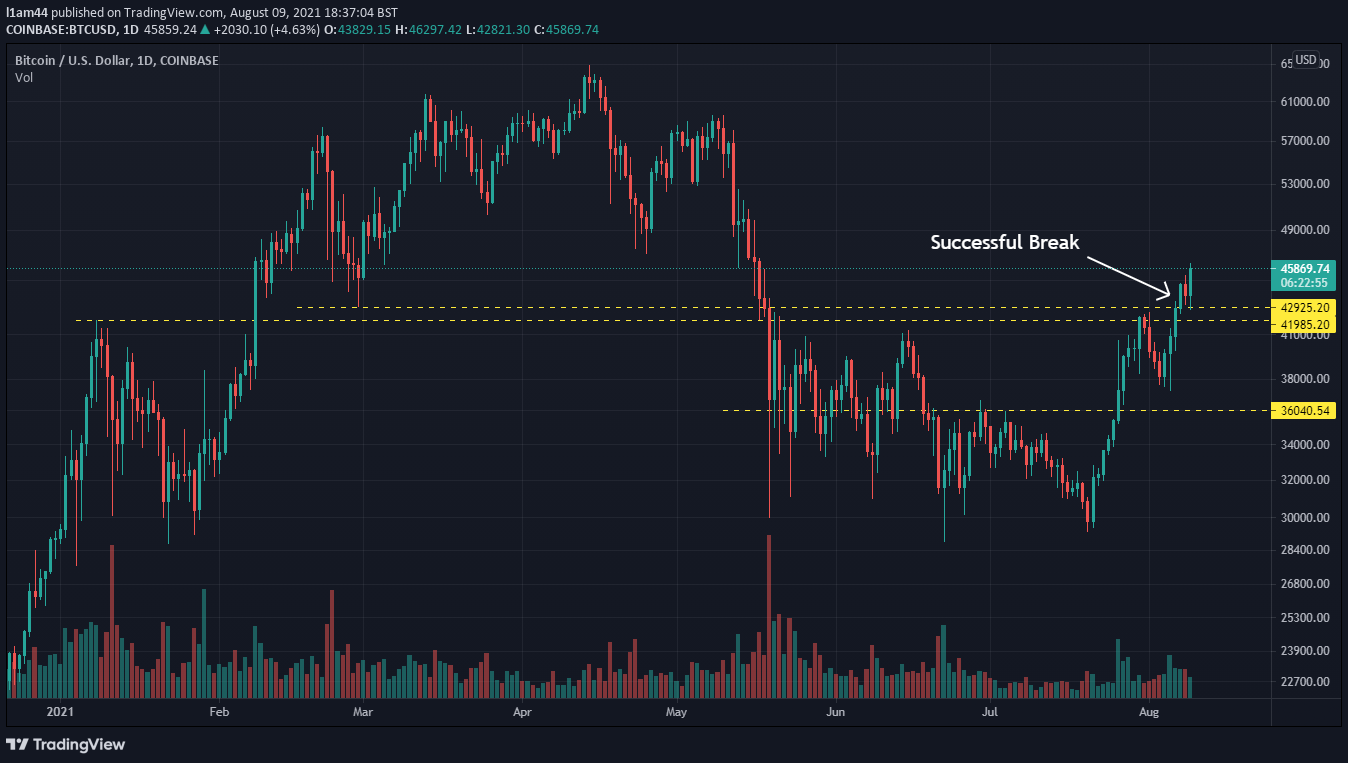
Just to summarise, what we have seen for Bitcoin is a clear breakout above our key resistance level of $42,000-$43,000. This breakout occurred on August 7th with a bullish candle close near the highs of the day.
This close, above the key resistance, confirmed a successful breakout, allowing Bitcoin to continue pushing higher. As of the time of writing, Bitcoin is currently testing $46,000, leaving its previous accumulation zone of $30,000-$40,000 behind.
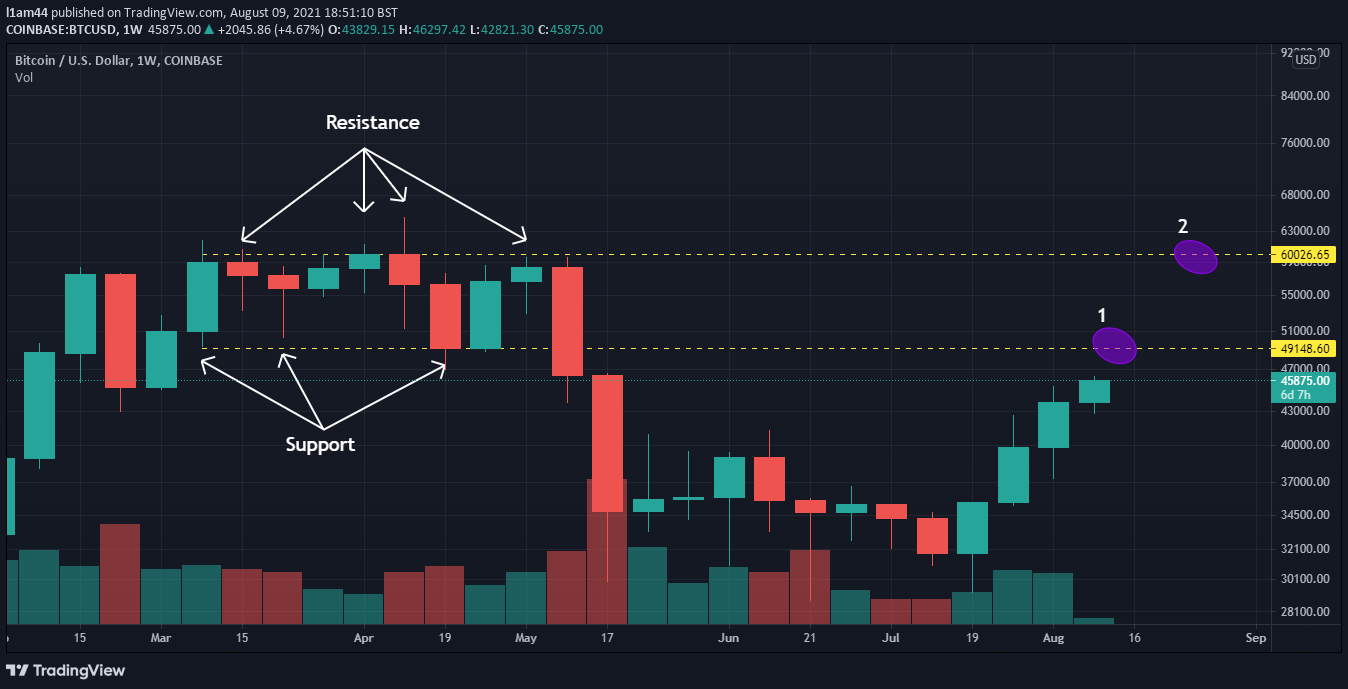
This is the breakout I have been discussing previously on the newsletter, and now the question becomes - how far will Bitcoin go before another significant trend reversal? For those interested, the first level I am looking at is approximately $49,000 and the next level up is approximately $60,000. (See Chart Below)
With this analysis in mind we can say that Bitcoin is currently experiencing a period of strength, relative to the previous, neutral, trend which was following a sharp downtrend.
Now, historically what we have seen is that, during prolonged periods of volatility to the upside (price increase) for Bitcoin, altcoins can significantly outpace Bitcoin and reward investors with higher multiples of returns on their investments.
To quickly explain why this is the case, the reason for this is risk appetite. Whilst Bitcoin (the largest & most trusted cryptocurrency) is performing well, market participants turn towards a risk on mentality. Higher prices create higher levels of excitement, which in turn drive more speculation and higher risk taking. This can then drive investors to look towards smaller, higher risk Cryptocurrency investments (Altcoins), where the smaller market capitalisation (market size) and lesser known, but potentially up and coming, Cryptocurrency has a far greater upside potential than A more established, slower moving, Bitcoin market.
In short, this is what leads to bubbling altcoin booms and busts - Market psychology leading to more risk taking during a strong bull market or strong rally from Bitcoin.
This leads me on to my thesis - Altcoins will rally further than Bitcoin, but after Bitcoin finishes with its breakout.
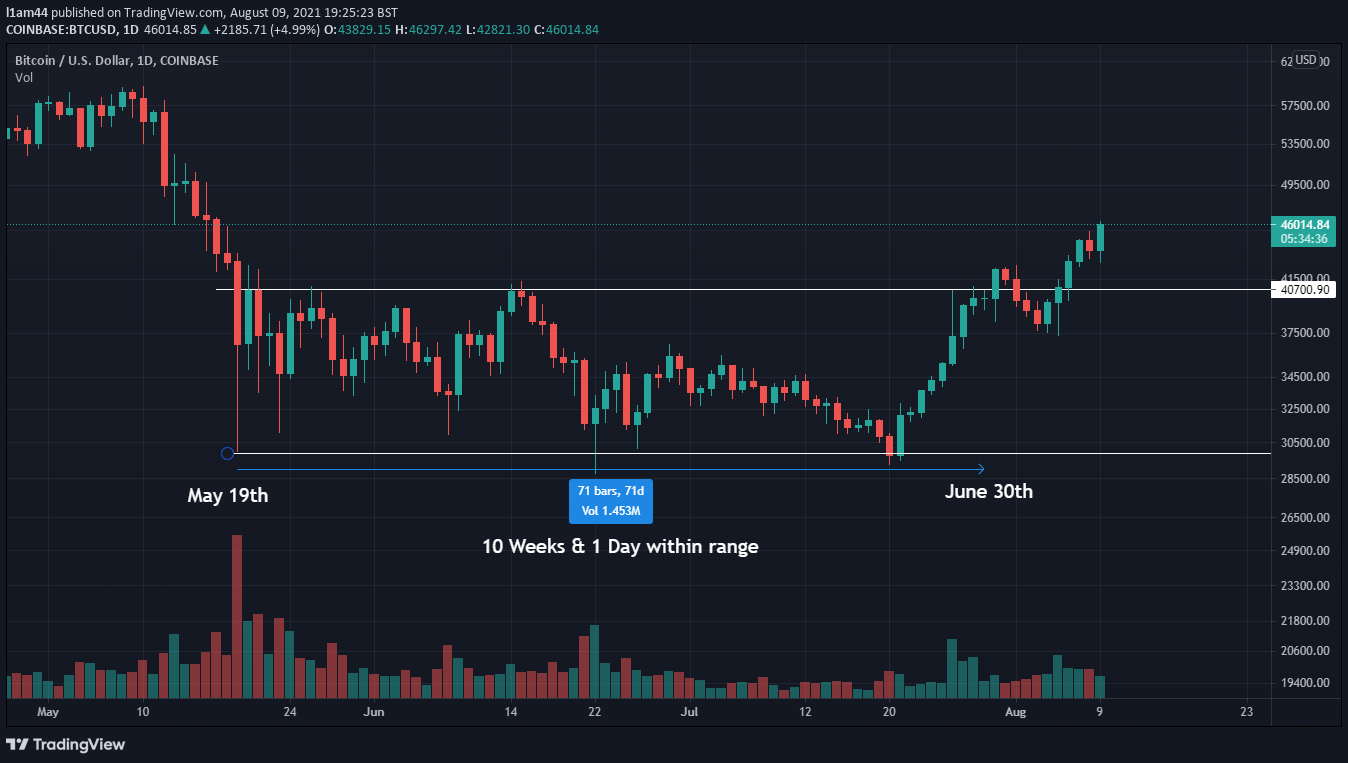
Since Bitcoin has broken out from the prior range ($30,000-$40,00), of which it had been moving within for over 10 weeks (see below), and therefore is showing strength in a bullish market (at least for the short term), there is potential for increased risk taking and therefore an Altcoin rally.
I am speculating that this period of significant bullish price action for the broader altcoin market, will come towards the end of or at the end of Bitcoin’s current rally in price. Whilst Bitcoin increases in value, altcoins certainty will as well, but not faster (generally). However, once Bitcoin looks to cool down and consolidate, or even pull back, altcoins will step up and take the lead, outperforming Bitcoin fairly reasonably. However, this is only speculation.
Lastly, for this section, it is important to understand that a thesis is an idea. It is only something you have in mind for how the market can play out based on information and what you see.
Therefore, a thesis is not something to act on alone, and instead we must look to the data, and from a neutral perspective, to see if any signals or data points are in favour of an altcoin rally.
Let us take a look at the charts for Bitcoin Dominance, Altcoin Season Index, and the Early Movers…
What Do The Altcoin Charts Say? Bullish Altcoin Action?
Bitcoin Dominance
So now we have cast our thesis aside for the moment to take a neutral perspective on the market, let us take a look at Bitcoin Dominance, a metric that I explained in the previous newsletter.
It shows us the percentage dominance Bitcoin has over the entire Cryptocurrency market, based on market capitalisation.
Now let us look at the chart below.
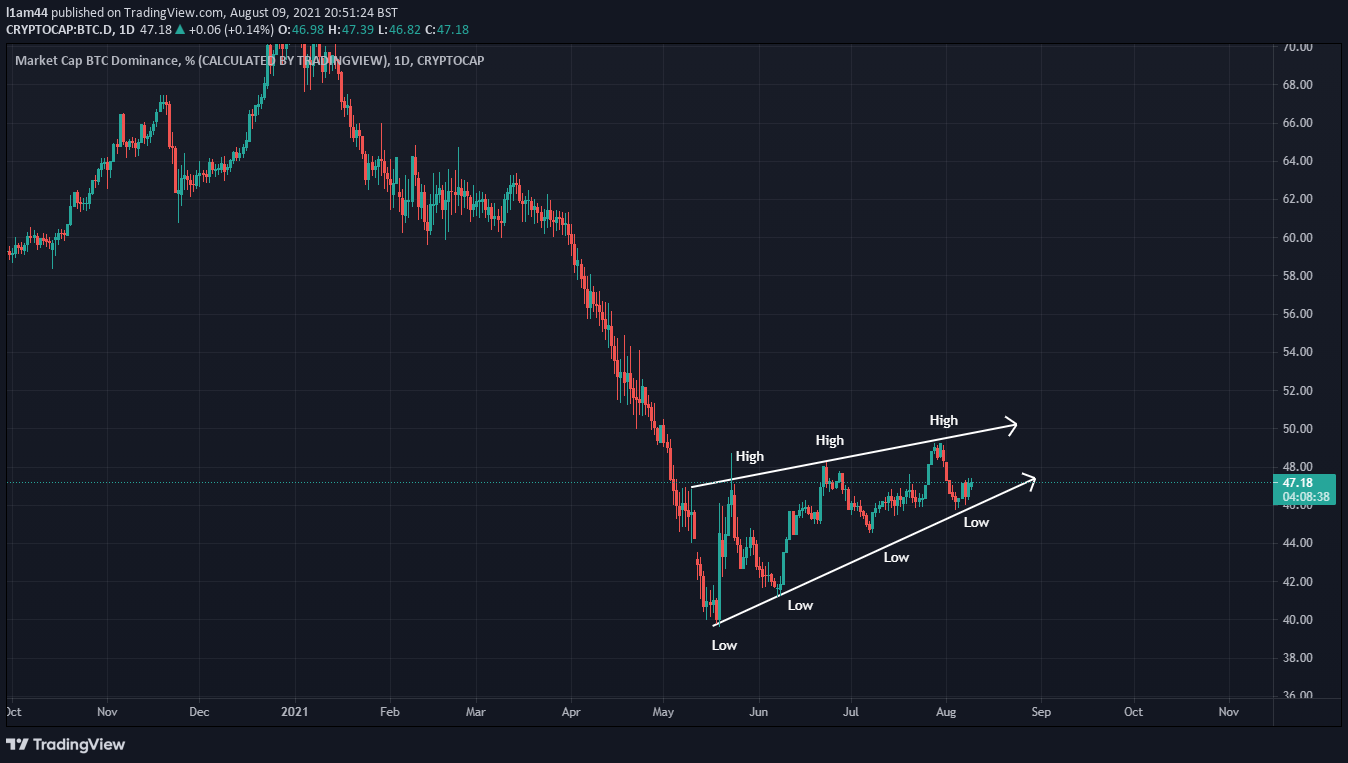
As discussed in the previous newsletter, Bitcoin Dominance has been on the decline since the start of 2021, shown very clearly by the above chart. Also, as discussed in the previous newsletter, Bitcoin Dominance has been steadily, but slowly, rising since the low on May 19th. Bitcoin has continued to make higher highs and higher lows, based on candle closes since May 19th and continues to hold this structure.
In order for us to be bullish on Altcoins for a reasonable or sustainable amount of time, this higher high (HH) and higher low (HL) structure would need to change to, and be replaced by, a lower high (LH) and lower low (LL) structure on this daily chart.
Ultimately, what we are looking for is a continuation (at least for the short term) of the prior trend leading up to the increase we are currently seeing in Bitcoin Dominance. This would show that Altcoins are resuming their prior trend of outperforming Bitcoin.
Now, despite this uptrend for Bitcoin Dominance, there is one thing I would point out to the reader. The current uptrend we are seeing is slow and steady. It is by no means recapturing, at a fast pace, the previously lost dominance from Bitcoin to altcoins.
For this reason, as you will see on the next chart, I consider this increase in dominance closer to that of a consolidation of current dominance levels. A pause in the prior trend, if you like, with a potential for a serious reversal, or a continuation of the prior trend. (See Chart Below)
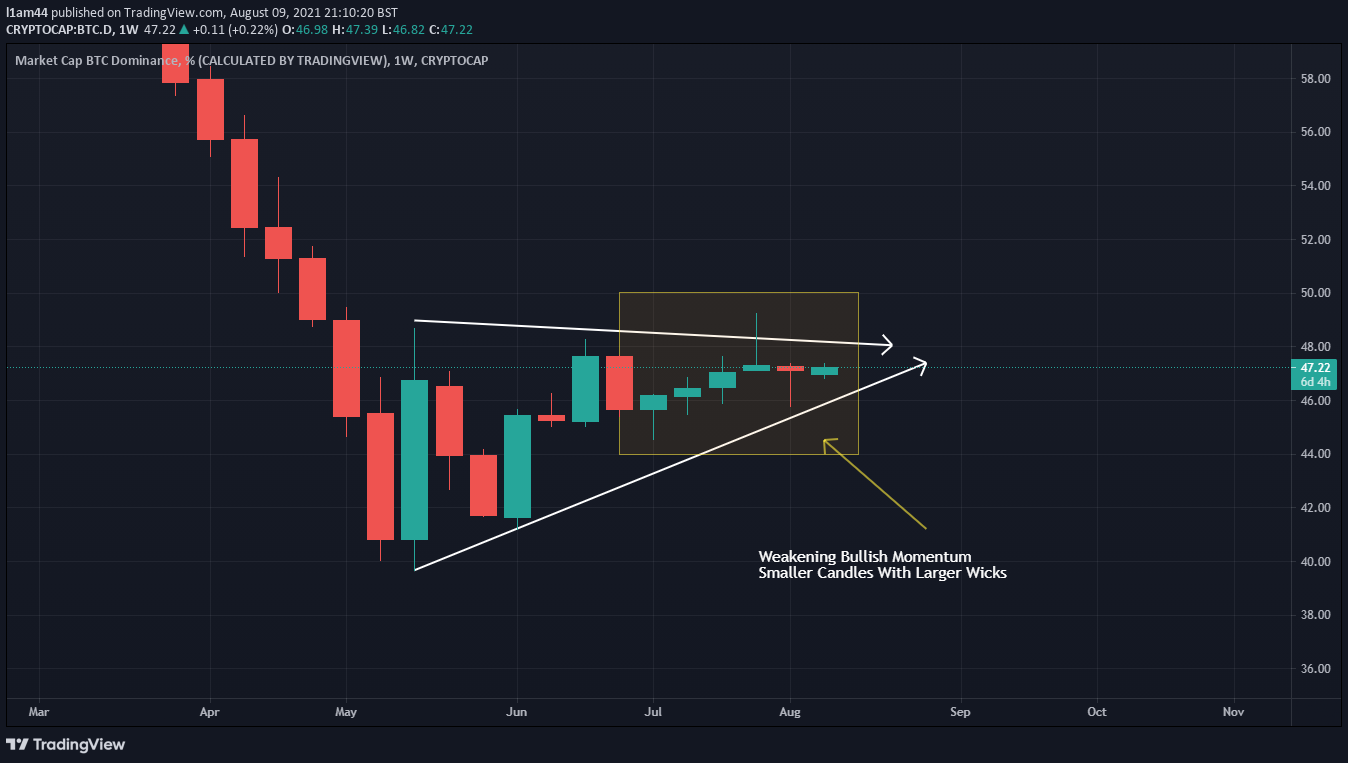
What you are looking at here is the exact same Bitcoin dominance chart as before (zoomed in a little) but on a weekly timeframe. Now each candle represents 1 weeks worth of price action.
Instead of this clearly defined, slow and steady uptrend just as we saw in the prior chart, we have a more consolidated look. Though the weekly chart does show a bullish reversal pattern which completed on the week commencing May 17th (this is a bullish engulfing pattern for those more experience who are reading), what we see is higher lows, but not consistent, clearly defined, higher highs. This structure is distorted due to some wicks reaching higher than others at the short term peaks and candle closes falling short in making a higher high relative to the previous peak based on the candle closes.
Therefore, for me at least, and for my interpretation, I consider this slight and not at all standout uptrend to have similar implications to a consolidation pattern of neutral trend - meaning there is room for a stronger uptrend to start, or a resumption of the downtrend. It could really be seen as a 50/50 chance without combining with other indicators and market analysis.
In support of this, we also see diminishing bullish momentum in recent weeks for Bitcoin Dominance. This is shown by relatively small bullish candles compared to those at the start of the trend. They also have fairly large wicks (shadows) relative to their body size, indicating indecision.
So in conclusion, Bitcoin Dominance is not flashing a signal for Altcoins to rally. After all, it is a representation of Bitcoin’s performance vs Altcoins and so, it would always show us the signal once the rally had got underway.
Therefore, let us turn our attention over to the Altcoin Season Index.
Altcoin Season Index
The Altcoin Season Index was another indicator we focused on in the previous newsletter. This indicator analyses the performance of the top fifty altcoins over the last 90 days, relative to Bitcoin’s performance.. A score of 100 represents every altcoin outperforming Bitcoin over the last 90 days, and a score of 0 represents none of the fifty altcoins outperforming Bitcoin.
Let us take a look at the following chart
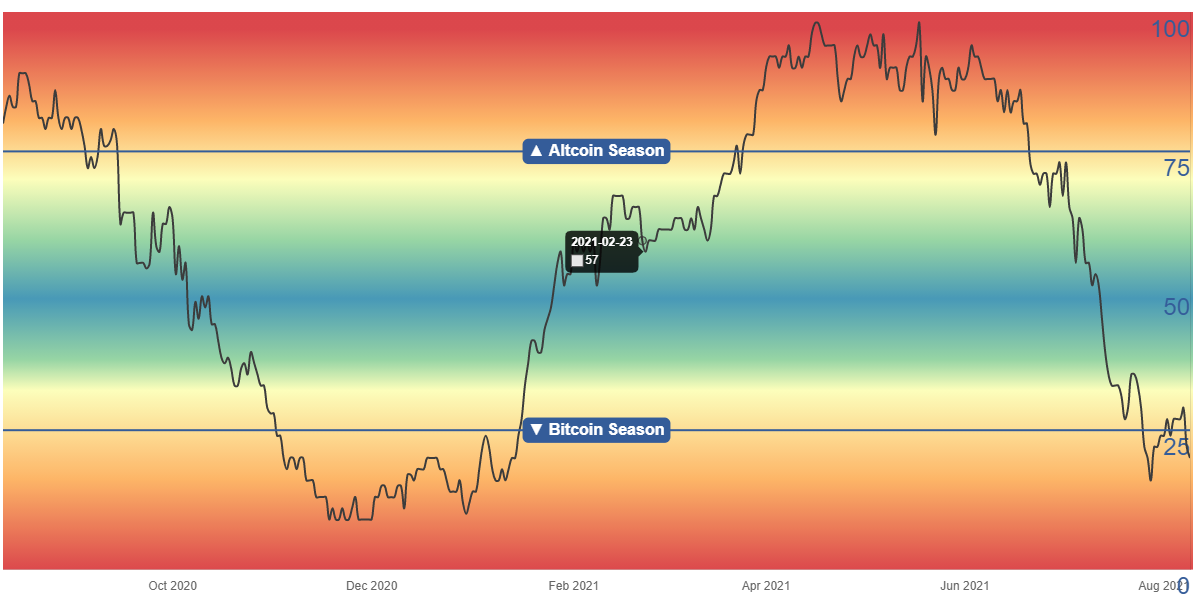
As we can see from the above chart, less than 25% of the top 50 altcoins have outperformed Bitcoin over the last 90 days, and therefore we are in Bitcoin Season.
As we spend time below 25 on this chart, Altcoins can be considered to be undervalued relative to Bitcoin. Bitcoin has been outperforming compared to Altcoins, and at some point, this momentum will likely shift to a period of Altcoins outperforming Bitcoin. Keeping the interpretation of the chart simple, the longer we stay below 25, the stronger the suggestion that altcoins are undervalued relative to Bitcoin.
This means that right now, as we are towards the lows of this oscillator, and below 25, we are at a level which is indicative of a period of bullishness for Altcoins. Historically, we spend some time in this range before returning to the highs above 75, and back in altcoin season.
The one downside to this chart is that we have only spent a small amount of time in this lower range, below 25. If we look back to the previous visits of the upper band (75 and above) and the lower band (25 and below) , in the last year we have tended to stay within these bands and level out for a short while - something we have not yet done on our current visit of the lower band.
While this could suggest more time in this band is needed, it is not essential and in the past we have not always stayed here for long.
In conclusion, the Altcoin Season Index does give us a signal that altcoins could be ready to rally. It is at the level at which altcoins historically have rallied from. However, more time could be needed to form a bottom on this metric.
Finally, let us look at early movers in the altcoin market.
Early Movers
Early movers in the altcoin market can be a great way to spot strength in the broader altcoin space. Early movers, I find, are often the stronger altcoins. These can be trending altcoins such as the recent boom in the NFT sector, or they can simply be altcoins that are the largest, or performed the best in previous cycles. Whichever they are, they can be a good indication for what’s to come from altcoins which could be a little slower to move.
In similar fashion, Bitcoin can be seen as an early mover relative to altcoins. If a strong Bitcoin leads to a strong rally for altcoins, that would mean that altcoin rallies are just a delayed reaction to a Bitcoin bull run.
So you can see how these early movers can, in fact, act as early indicators as to the strength of the market. So let us take a look at a few individual charts I have been following.
Ethereum
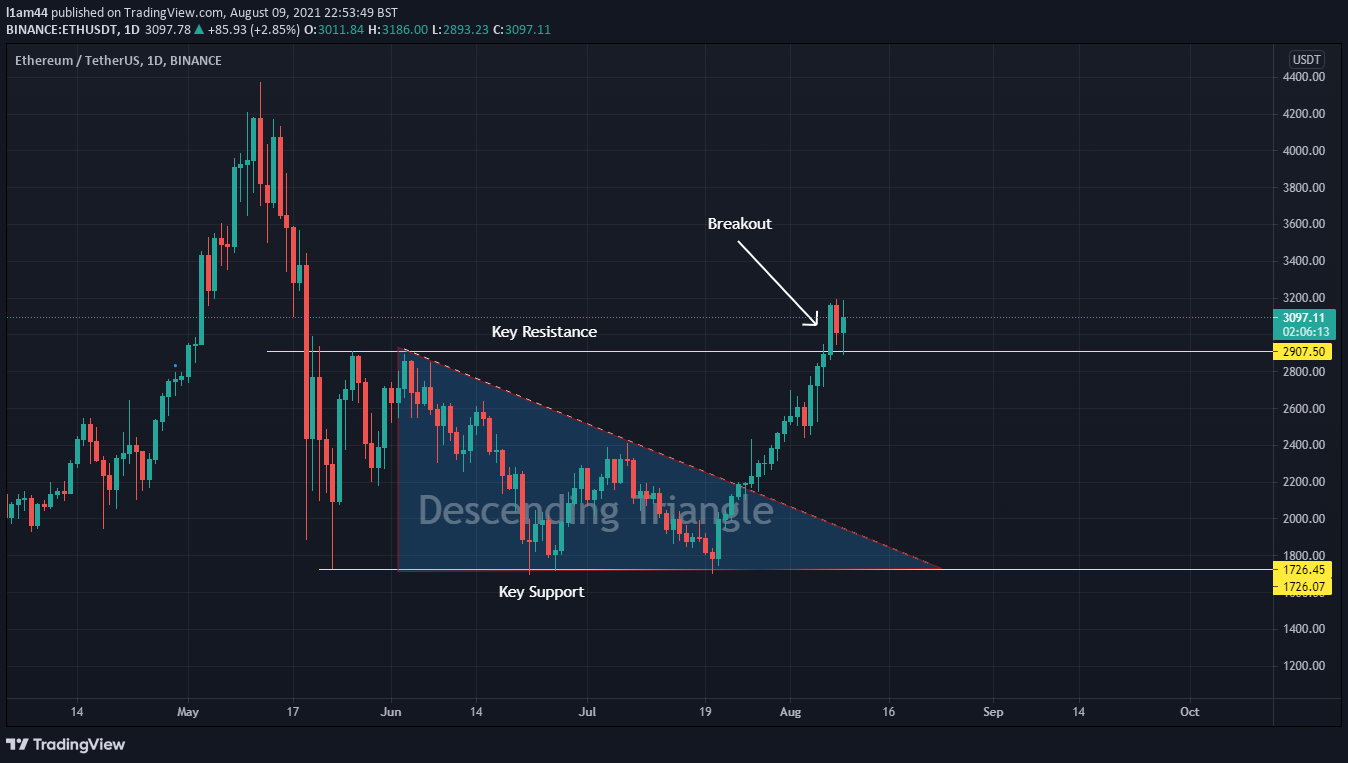
Above is the Ethereum 1 day chart. As seen on the chart, we have a key support level at approximately $1700 which had held three times, and a key resistance level at approximately $2900 which was tested three times prior to the breakout. Support was tested on May 23rd, June 22nd & June 26th, and then a third time on July 20th, before returning to the highs of the range (and for the more technical reader, breaking out of a descending triangle to the upside in the process).
Ethereum briefly consolidated below the range highs, just before breaking above the resistance the next day, on August 7th, just 2 days ago. Now if it can successfully consolidate above the resistance, and make it support in the process, Ethereum has the potential to try to test towards its all-time high of around $4400.
This breakout above the range highs, and resistance, shows that Ethereum is potentially leading the altcoin market. Many altcoins are yet to test key resistance levels, but Ethereum’s early break above could be a signal that other altcoins will move in the future.
Ethereum’s significance is notably greater than other altcoins also. It is the 2nd largest cryptocurrency by market capitalisation. Additionally, it accounts for approximately 38% of the entire value of the altcoin market (as of the time of writing). Because of this significance, I pay Ethereum special attention when analysing it as a potential early mover in the altcoin market.
Just as Bitcoin strength can lead to speculation in altcoins, including Ethereum, Ethereum strength can lead to speculation in smaller, higher risk altcoins as well.
Let us look at another altcoin chart.
Terra (LUNA)
Terra and its token LUNA, was one of the best performers in the prior altcoin market rally, and it has solidified itself amongst the top 50 cryptocurrencies and as a ecosystem with its own native stablecoin - UST.
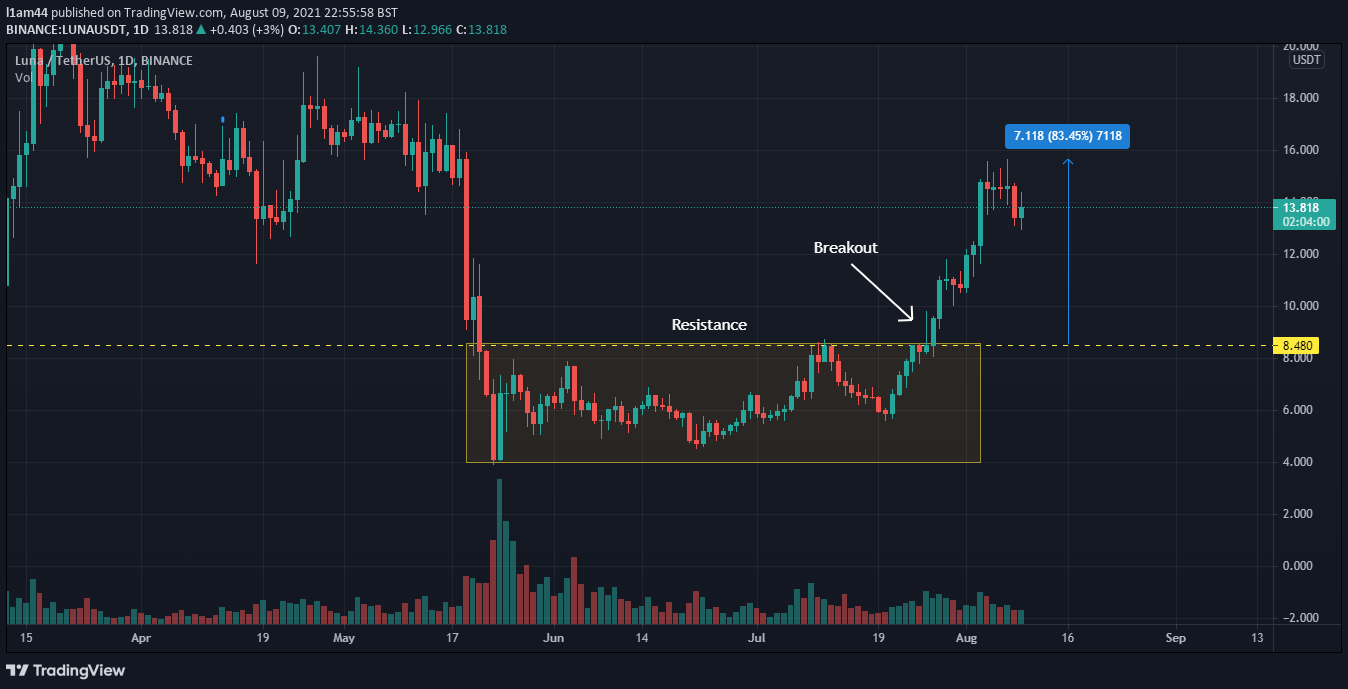
This chart highlights a period of consolidation after a sharp sell off, with lows of $4.00, and a resistance level at approximately $8.48. Whilst not visible on the chart, this level was significant resistance multiple times during the months of February and March.
Just like with Ethereum and its respective chart, Terra broke out above its resistance successfully. The difference is that Terra broke out in late June and had a significant rally of nearly 85% from the breakout point. Could Ethereum follow in similar stead? The real significance here is that relative to the altcoin market Terra (LUNA) is showing strength and this could be due to the fact that Terra is front running the market - ie it is moving ahead of the others. Whilst this is speculation, if this were the case, and one was to correctly identify this, a reasonable profit could be made from taking position on altcoins which are yet to move.
Now, I have one last chart for us to look at.
Terra Virtua (TVK)
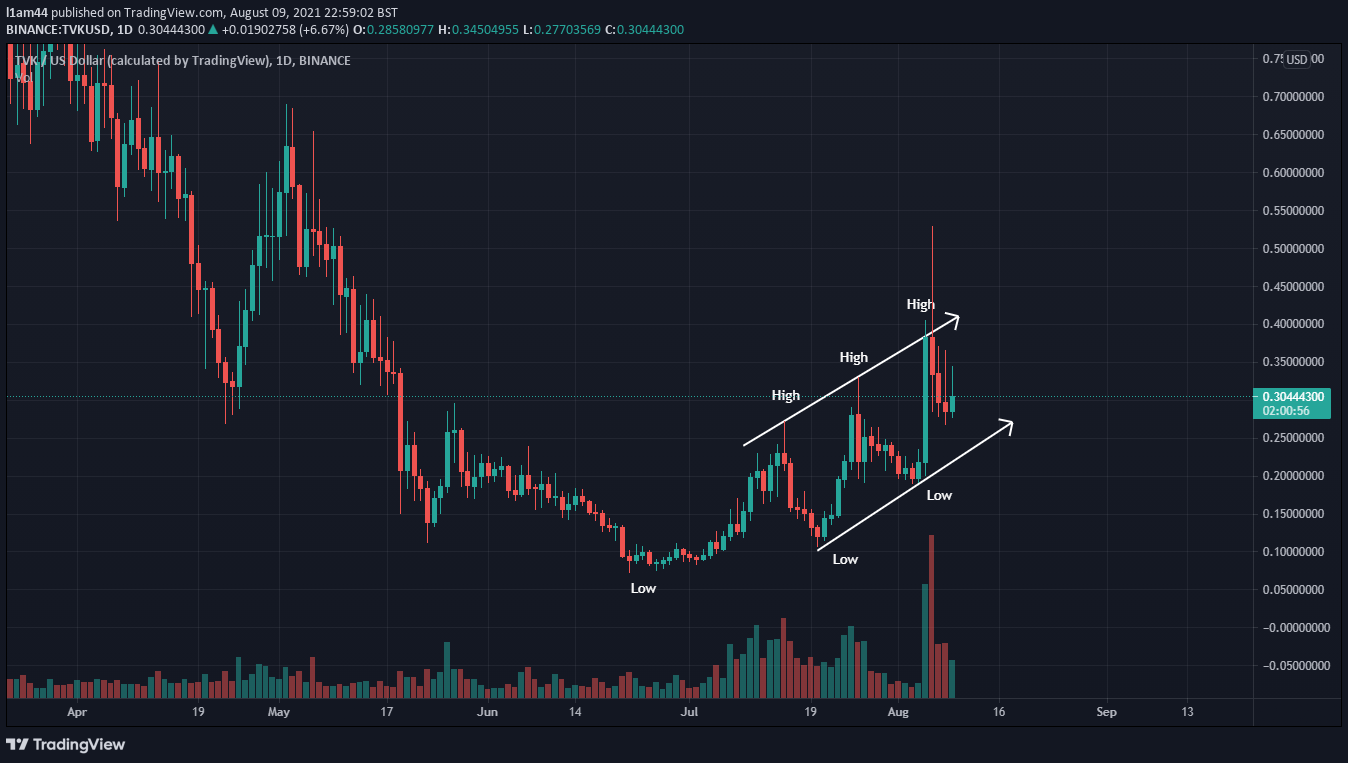
The final chart I would like to show is for the low cap NFT sector Altcoin - Terra Virtua. It’s selection for this early mover section is simply for it to be another specimen for us to examine, but of very different qualities to that of the larger Ethereum and Terra, being a small cap altcoin, and being an altcoin from within the NFT sector - which has many altcoins, that have outperformed in recent weeks, within it.
We can see on the chart above that Terra Virtua, since forming a low on June 22nd, has been establishing higher lows (HLs) and higher highs (HHs) ever since. This shows that this altcoin, along with others in the NFT space, has been front running the majority of the altcoin market for the last 7 weeks. Again, I ask the question - could these altcoins be an early indication of what is to come for more altcoins in the coming future? Will other altcoins also establish higher highs and higher lows on a daily chart over the course of 7 weeks? If so, there are opportunities for many altcoins to rally, playing in to my original thesis that Altcoins will rally in the future once the dust settles for the recent Bitcoin breakout.
To conclude this sector for early movers as an indicator for altcoin price action, I’d like to say that the difficult comes in identifying if an altcoin is an outlier (in other words going against the broader market trend), or if it is a front runner (moving ahead of the broader market trend).
This is an assessment that is probably best done in alignment with assessing other signals and market indicators, and should also be done in such a way as not to cherry pick particular altcoins to fit your bias, let’s say a bias towards a thesis for example.
Hopefully you can see that my analysis and views on the market are not concrete, and they are not without bias, even if only the unconscious kind. Nothing is a sure thing but, in conclusion, my analysis for the market right now is the following...
What Do The Altcoin Charts Say? Conclusion.
Based on the 3 areas we have looked into throughout todays newsletter, In my opinion, the altcoin markets look set for a rally.
Whilst the Bitcoin Dominance chart shows a steady uptrend, its recent weakening in bullish momentum shows the possibility of a pivot. This could be towards a decline in dominance, which would be great for altcoins, however the reverse is also true. - Therefore, the indicator is neutral.
Next we had the Altcoin Season Index, this showed us Bitcoin has been outperforming the majority of larger altcoins. However, this meant the indicator was towards a lower range, from which altcoins have previously seen significant rallies, suggesting an altcoin strength relative to the price of Bitcoin might not be too far way. Therefore, this indicator is bullish.
Lastly we have Early Movers, Ethereum is the most significant here, and with a breakout above a key resistance continuation is possible, following in the path of Terra and opening up the possibility of a sustained uptrend, similar to what we have seen since June for many NFT altcoins such as Terra Virtua. These market front runners are indicative of strength within the altcoin market, with a range of different altcoins performing well relative to others. Perhaps even more powerfully, we currently see Bitcoin breaking out and front running the altcoin market, meaning it’s own breakout contributes to the argument for Early Movers in the crypto space suggesting a rally for altcoins. For this reason, in my opinion, this indicator is bullish also.
With this we have 2 out of a possible 3 indicators in a bullish stance (according to my own opinion of course, the reader will need to formulate his or her own assessment), and because of this I am expecting an altcoin rally.
Thank you for reading, I hope you found the analysis in this edition to be valuable. If so, please consider subscribing so you can stay up to date with my analysis, and share this with others you know.
I’ll be back with another update next week.
Until then you may find me on YouTube here
https://www.youtube.com/channel/UCNk61EYTjDBfrFE6L_9qkhA
Or on Twitter here
https://twitter.com/L1am_Crypto