
Bitcoin & Altcoin Weekly Update (2nd Aug 2021)
Bitcoin & Altcoin Weekly Update (2nd Aug 2021)
Whilst Bitcoin Pulls Back Below $40,000, Can Altcoins Find Any Momentum?

This is the 2nd Edition of the Bitcoin & Altcoin Analysis Newsletter - the Confident Report
In this edition, we will follow up from the previous edition and its analysis of Bitcoin. We finally saw a pullback after a sustained rally for Bitcoin lasting 10 days - the first substantial rally we have seen for Bitcoin since crashing down into the $30,000 range on May 19th.
Additionally, we will be analysing the Altcoin market in an attempt to ascertain whether we could see some strength in the altcoin market in the future.
Bitcoin Above $40,000, But Prices Are Short Lived!
As of the time of writing, Bitcoin is currently priced at approximately $38,800. This came after a sustained rally to $42,670 along with a daily candle close above our previously mentioned resistance level of $40,000.
Let us quickly discuss this move here, as well as the range support and resistance again. (See Below)
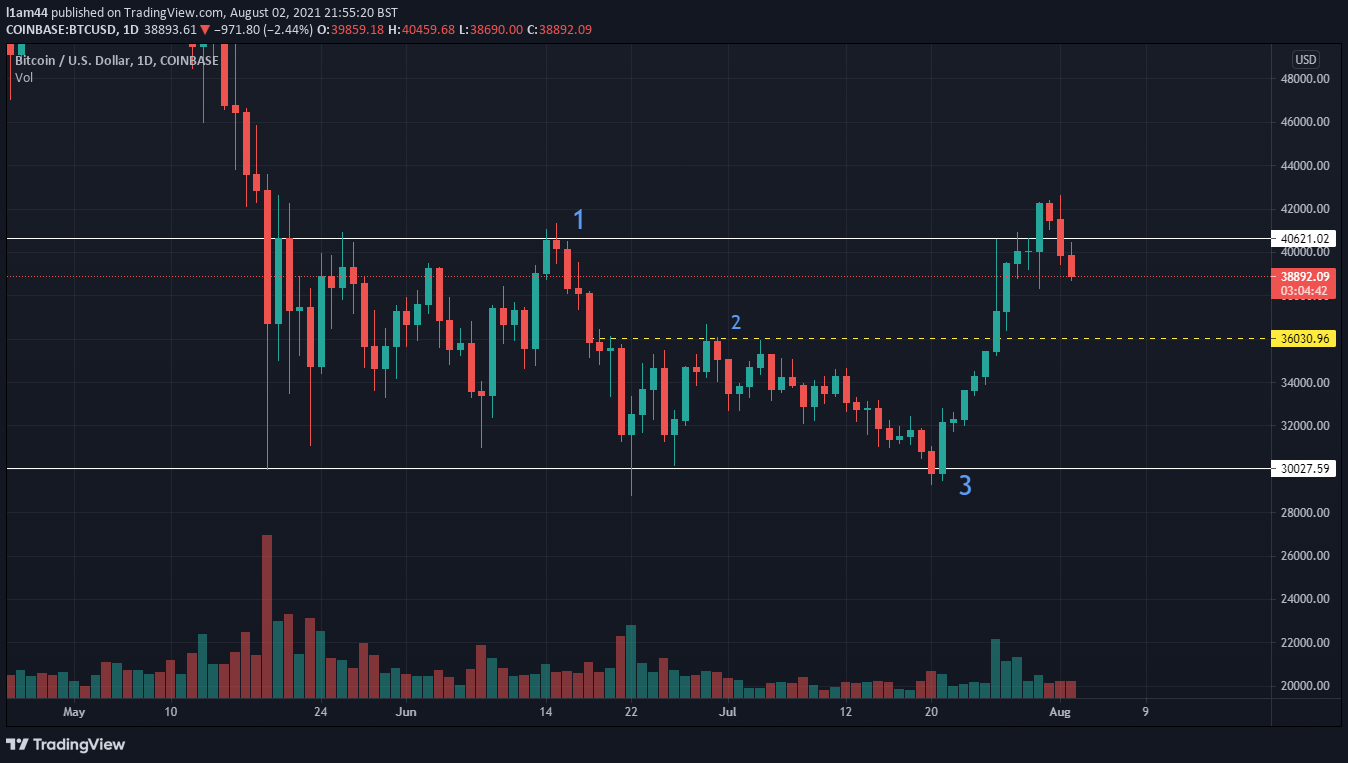
As you can see in the above chart, I have labelled the support and resistance levels discussed in the previous newsletter here as points 1 and 3
1 - the horizontal resistance of the range, with price testing these highs in late May and early June 3 times in total. Bulls were unable to close a daily candle above this level at $40,000 until the recent break above (shown on the chart) on June 30th
3 - the horizontal support of the range. It had previously been tested multiple times with the majority of the candles having been bought up presenting a long lower shadow, with lows close to, or around, the $30,000 level. (Lower shadows indicate buying pressure and the potential for a price reversal)
These two levels set the range Bitcoin has been trading in since it was entered into on May 19th.
As seen on the chart, the price of Bitcoin broke out to highs of $42,671, successfully closing above our range resistance of $40,000. However, after our first bearish candle close (31st of July) we have seen a continued sell off the following day and a close back below our range resistance (See Below)
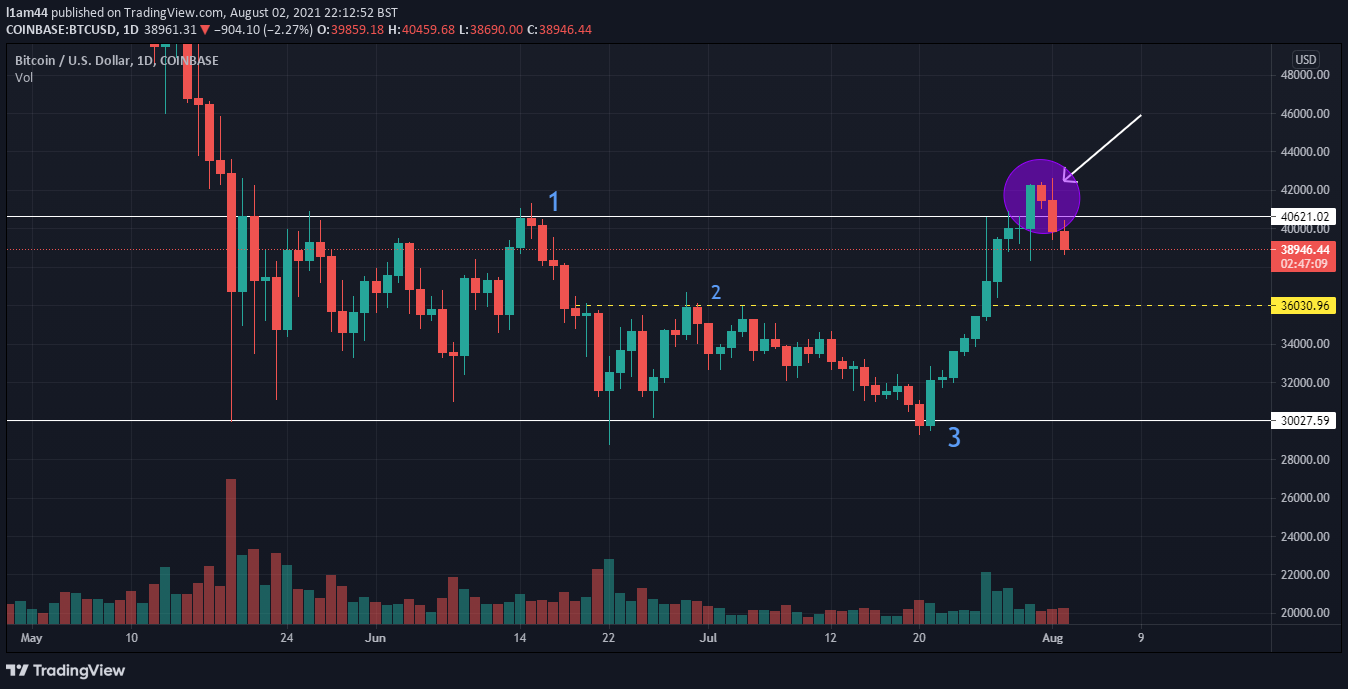
For those of you looking for an immediate support - see point 2, an immediate support level, previously acting as short term resistance close to the middle of the range
With this swift move back within the range, we can consider the $40,000 resistance to still be intact however this resistance has now become weakened however I will explain how we can still consider this area between $43,000 and $40,000 a strong resistance until proven otherwise.
Let us develop our analysis of this chart a bit further.
$42,000-$43,000 - A Resistance Just Above The Range
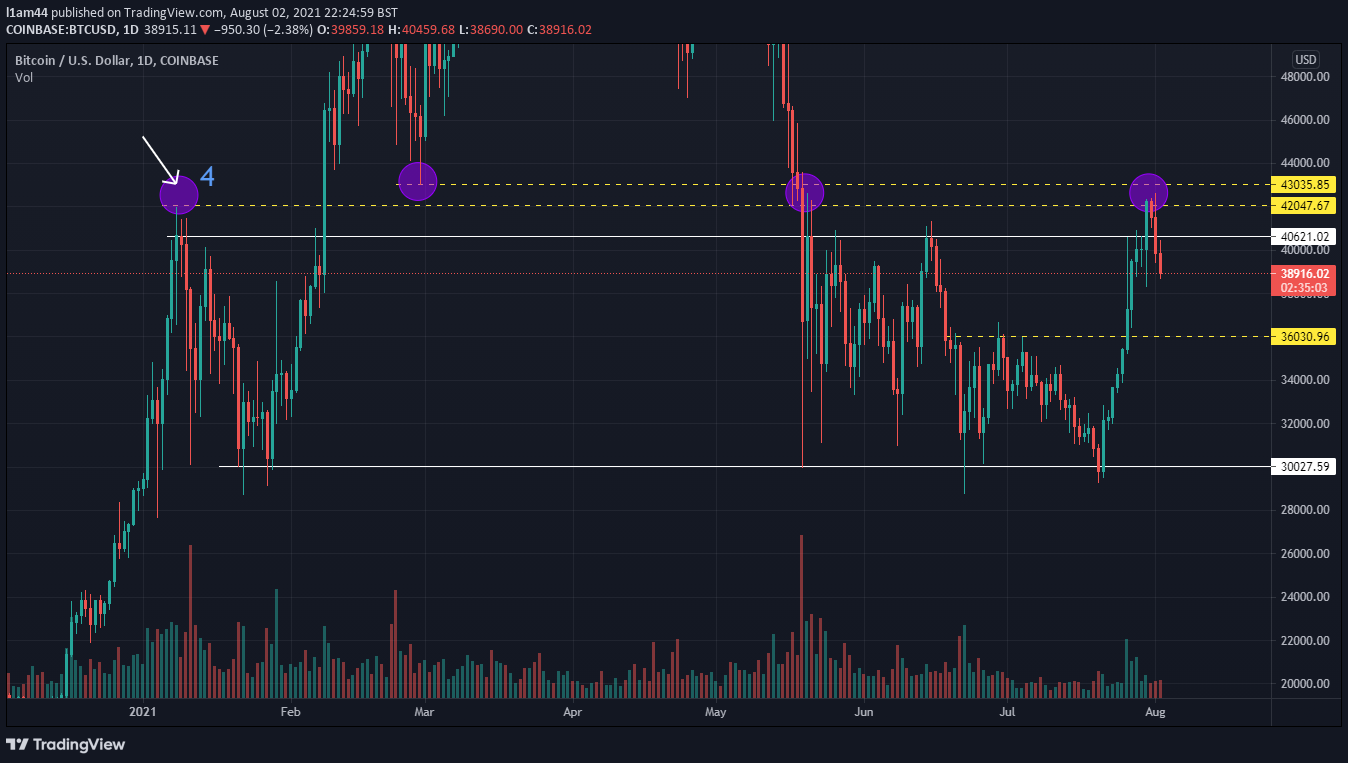
Until Recent price action I did not know whether there was a need to put significance on the price level of $42,000-$43,000, but with the recent move from Bitcoin breaking above $40,000 only to reject at the above levels it is clear, at least to me, that these levels need to be taken into consideration. I have labelled them on the above chart as point 4.
4 Shows Resistance at $42,000 (Jan 8th) temporarily halting a stunning move from Bitcoin which had risen from $10,000 just 4 months earlier. Note how this pullback also found support at our $30,000 support level later in the range.
Alongside the catalyst of Tesla purchasing Bitcoin for their balance sheet, Bitcoin finally broke above, later confirming (backtesting) the previous resistance of $42,000 as support on February 28th. (This move happened to find support $1000 higher at $43,000)
After breaking down from $65,000 and into the range we have been discussing up until now, Bitcoin found resistance between $42,000 and $43,000 twice on May 20th and August 1st respectively.
The trained Eye may notice that may of these tests of the $42,000-$43,000 resistance came in the form of wicks, with the candle bodies closing below our range resistance of $40,000. This is what can make it difficult to ascertain the significant resistance level.
And so in conclusion, Bitcoin continues to act within our defined range as we now turn our attention to $42,000-$43,000. Should Bitcoin find support such as at point 2 we can see how bulls and bears react to these levels with a clear and sustained breakaway from $40,000 needed for us to be confident we are exiting the range for the foreseeable future.
Now let us briefly turn our attention to the broader Altcoin market.
Getting A Feel For Altcoin and Bitcoin Money Flows.
I would love to break down the entire altcoin space for you in a single edition of this newsletter, however the sheer amount of analysis required to cover them I cannot do in a single edition. So in this edition I’d like to give you a broad analysis with 2 important metrics I follow.
Before we get into this Altcoin market analysis, I would just like to explain a couple of points to keep in mind.
1) Not All Altcoins Are Created Equally - The altcoin sector is vast, and different altcoins will move at different times. Whilst the majority of altcoins will benefit from bullish sentiment (especially market mania), some altcoins will not move as much as others. This is also the case in bearish trends (downtrends). For this reason, each altcoin chart requires its own independent analysis.
2) Ethereum Dominates The Altcoin Market - Ethereum accounts for roughly 36% of the market value of all altcoins (as of the time of writing). Due to this some broader altcoin metrics are heavily influenced by the performance of Ethereum, as well as some altcoins themselves - Ethereum is a low risk play when compared to many altcoins and for that reason traders may only choose to invest in or trade higher risk altcoins whilst the market is healthy - something that could still be up for debate at this point in time.
With both of these points mentioned, let us take a look into Bitcoin Dominance, the 1st metric I use to get a feel for where the money in the market is flowing - It’s simple - is money flowing into Bitcoin or Altcoins? (See Below)

Bitcoin Dominance looks at the total value of all cryptocurrencies (Bitcoin & all Altcoins combined) and then shows how much of that total value Bitcoin accounts for (as a percentage).
In the above chart, Bitcoin has a dominance of 46.73. This means that Bitcoin accounts for 46.73% of the value of all cryptocurrencies. Simple right? So what does this chart show us?
Simply put, this chart shows us whether Bitcoin is gaining market dominance or if Bitcoin is losing market dominance. If Bitcoin is gaining dominance it is outperforming Altcoins, but if Bitcoin is losing dominance then Altcoins are outperforming Bitcoin.
This translates into a picture showing the money flow in the crypto markets. If Bitcoin dominance is increasing, the majority of money is flowing into Bitcoin. Some of this may even be directly from money exiting altcoins. If Bitcoin Dominance is decreasing the reverse is true, the majority of money is flowing into Altcoins.
Now, let us take a look at the following chart.
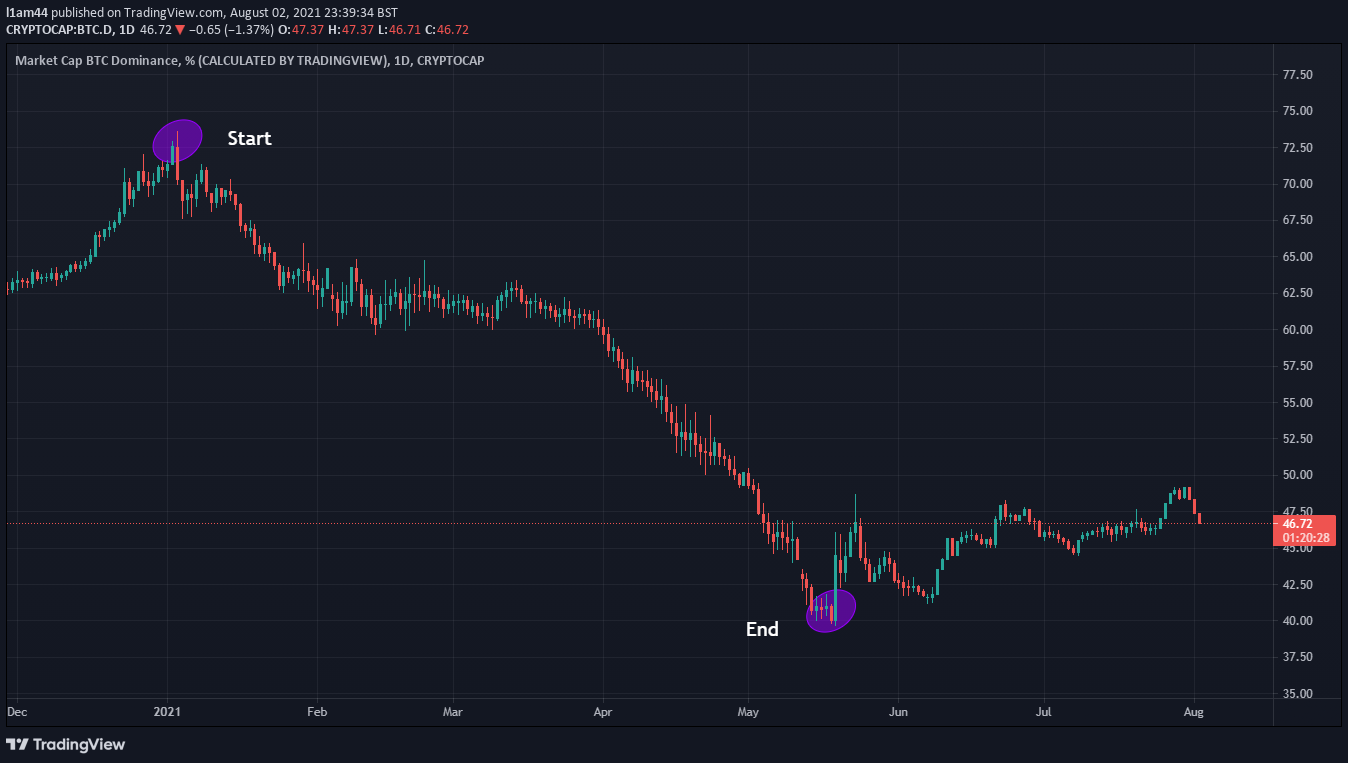
We can see two points on this chart, Start and End.
Start represents a pivot in the direction of the trend for Bitcoin Dominance on Jan 3rd. Until then Bitcoin dominance had been rising, but after, the trend changed direction leading to a sustained decline in Bitcoins dominance in the cryptocurrency market. This represented a massive period of growth for the altcoin market overall, with Bitcoin declining from 73.6% dominance down to just 39.7%, a decline of almost 34%, down to almost half its original percentage dominance.
End represents another pivot point on the chart on May 19th. (This just so happens to be the point where Bitcoin entered the $30,000-$40,000 range formerly discussed meaning altcoins had continued to decline generally, whilst Bitcoin remained in a neutral trend)
Here, Bitcoin dominance stopped declining and instead has been steadily rising, with higher highs and higher lows. We can therefore ascertain that for now, altcoins are no longer outperforming Bitcoin and instead, Bitcoin is outperforming altcoins having held up better since entering its range on May 19th.
This steadily rising trend for Bitcoin Dominance suggests that Altcoins are not yet ready to sustainably outperform Bitcoin, we must instead wait patiently for a reversal of this trend for this indicator to give us a bullish sentiment for Altcoins.
But personally, I do not use only 1 metric to make investment decisions
Let us take a look at another metric we can use (See Below)
Altcoin Season Index - An Oscillator In Altcoin Performance Relative to Bitcoin
What we have below is the Altcoin Season Index. This chart measures the performance of altcoins compared to the performance of Bitcoin. Just like with Bitcoin Dominance, we can use this to try and ascertain whether altcoins will outperform Bitcoin or vice versa.
In order to plot the chart, the Top 50 Altcoins by market capitalization (total value) at any given time are taken and then their performance against bitcoin is measured over the previous 90 days.
Next we have on the right axis a score between 0 and 100. If all 50 altcoins have outperformed Bitcoin over 90 days the score will be 100 and if none of the 50 altcoins have outperformed Bitcoin then the score will be 0.
Since the maximum score is 100 and there are 50 altcoins, each altcoin that has outperformed Bitcoin over the last 90 days adds 2 points to the overall score.
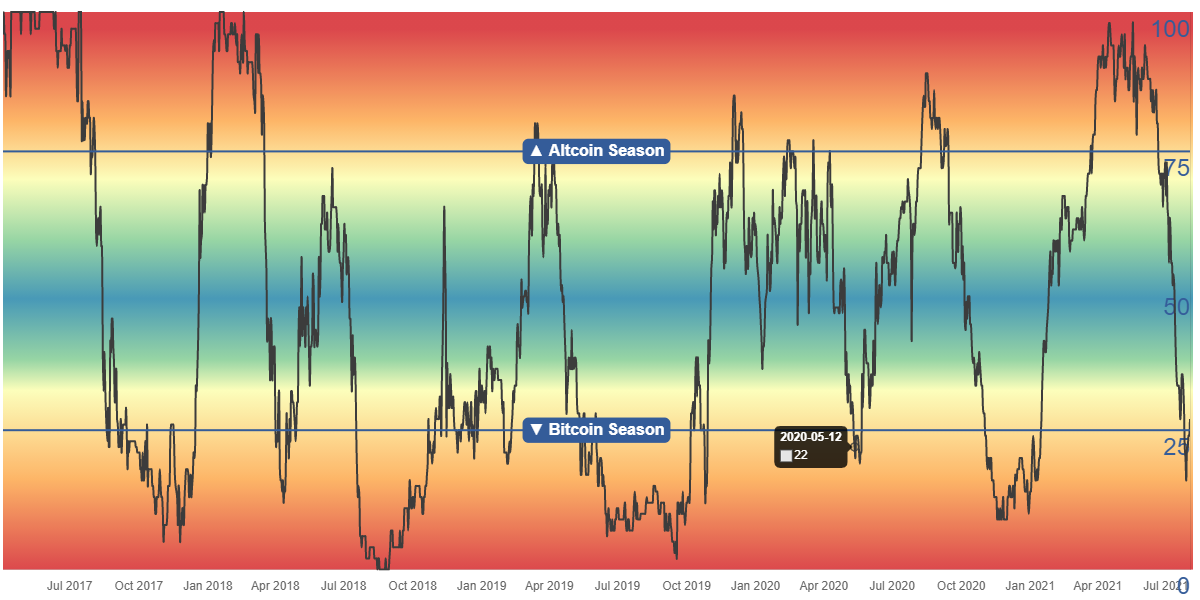
As you can see from the Altcoin Season Index chart above, any score below 25 is considered ‘Bitcoin Season’ meaning Bitcoin is outperforming the majority of altcoins. Equally, any score above 75 is considered ‘Altcoin Season’ as the majority of the top altcoins are outperforming Bitcoin.
(Note however that only the top 50 altcoins are taken into consideration. Despite this, I do find this metric to be reliable. Additionally, this does not measure and take into consideration to what degree altcoins have outperformed, or have been outperformed, by Bitcoin.)
We can see that since 2017, this metric has fluctuated consistently between the scores of 100 and 0 and for that reason I tend to consider this metric very similar in reading to that of an oscillator such as the relative strength index in traditional charting.
Now let us take a look at where on this oscillator we find ourselves today (see below).
Firstly, do not let the terms Altcoin Season or Bitcoin Season fool you. These highs and lows, respectively, show that we have already experienced a significant swing in momentum. Once the oscillator reads we are in Altcoin Season, altcoins have already had significant moves from their relative lows compared to bitcoin and the reverse is true once we reach Bitcoin Season.
Therefore, I tend to read this chart in reverse. When we are in Bitcoin Season we are nearing a pivot, a point where altcoins will begin to outperform Bitcoin and with that comes opportunity. Again the reverse is also true, when we are in altcoin season, for me, we are closing in to the pivot point in which Bitcoin will start to outperform altcoins and therefore reducing risk may be a wise decision. (It is however important to realise that this oscillator can only tell us how many altcoins are outperforming Bitcoin, those altcoins could continue to rise at the peaks of 100 in altcoin season and could continue to be outperformed by bitcoin in the lows of Bitcoin season. Again, I do not rely on any single metric for making decisions)
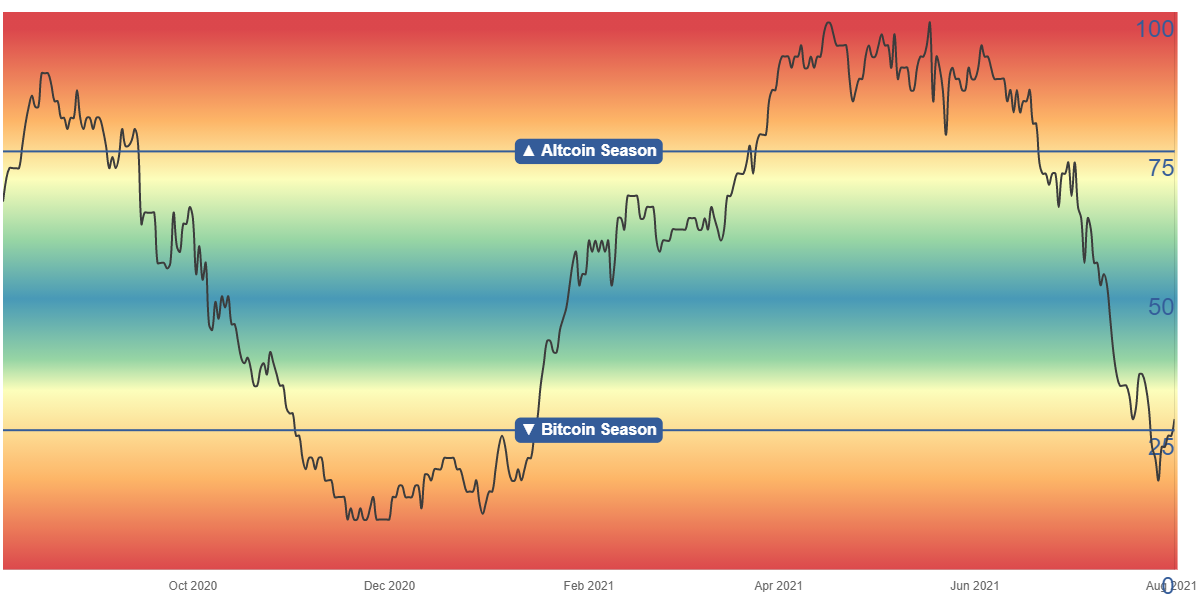
As we can see from the above, we are currently around the score of 25. This means that only around 25% of Altcoins are currently outperforming Bitcoin based on the last 90 days (this is on a rolling basis).
From this we can see that we are likely soon to be entering a through (low point) in the chart within the Bitcoin season range - remember how I said it is actually in the Bitcoin range we want to consider accumulating altcoins again - with plans to sell as we reach the altcoin season range.
In conclusion, what this chart shows us, is that we are approaching a point on this chart where we could see a pivot - where altcoins will once again outperform bitcoin, however for now we are still trending down into the Bitcoin Season range.
So should we see Bitcoin successfully exit its current range with a break above $40,000 followed by continuation, this could suggest an opportunity soon after or perhaps even before to accumulate altcoins ahead of their ascent in transitioning from being outperformed by Bitcoin to being the ones to outperform.
But until then, and until we see both Bitcoin Dominance and the Altcoin Season Index turn bullish, we have no clear evidence that Altcoins are about to go on a bullish run. Not from these charts, at least.
I’ll be back with another update next week.
Until then you may find me on YouTube here
https://www.youtube.com/channel/UCNk61EYTjDBfrFE6L_9qkhA
Or on Twitter here
https://twitter.com/L1am_Crypto