
Bitcoin Breakout Analysis & Litecoin Volatility Analysis.
Bitcoin Breakout Analysis & Litecoin Volatility Analysis.
Bitcoin & Altcoin Market Analysis & Weekly Insight #15

Bitcoin, after reaching a new all-time high on October 20th, had been consolidating around $60,000 until the 8th of November. Now, according to the technicals, this consolidation is over and Bitcoin is breaking out to new highs yet again.
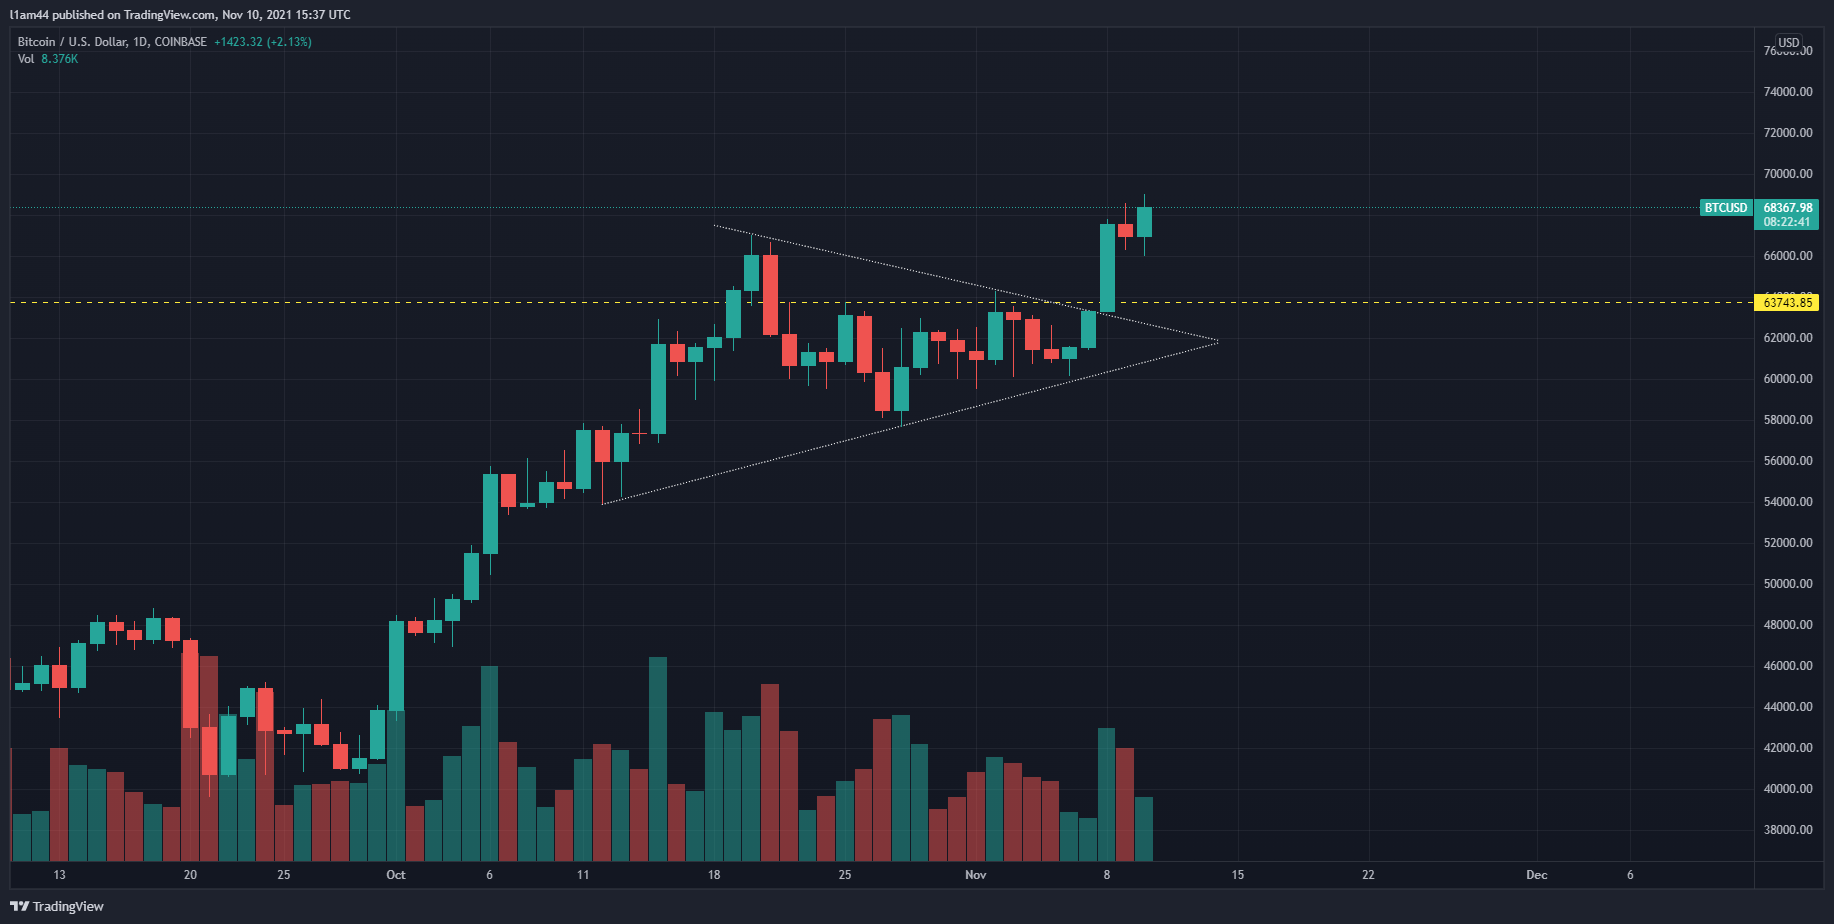
The chart above shows a technical pattern called a symmetrical triangle. Price action prints a series of higher lows and higher highs, creating a coiling pattern. As price action approaches the apex of the triangle, volatility, and usually volume, reduces. This period of reducing volatility typically ends with a break in either direction of the triangle.
We can see from the chart, that the direction of the break-out from this triangle was upwards. Analysing this pattern a bit closer as well as adding the Bollinger Bands indicator, we can see the following;
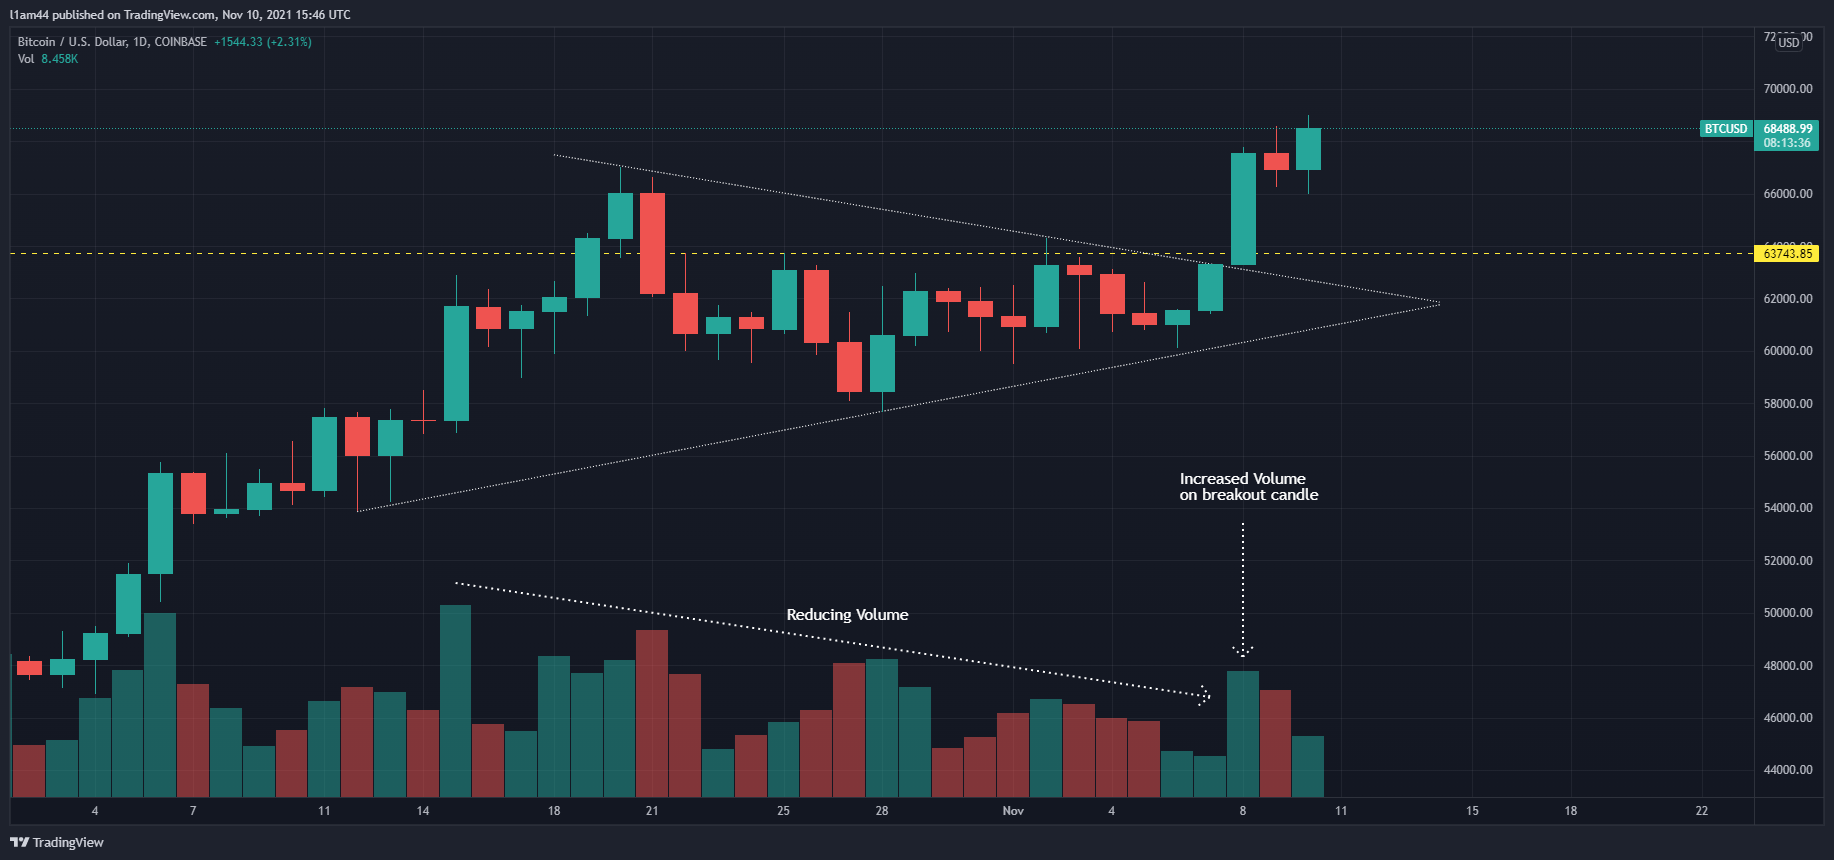
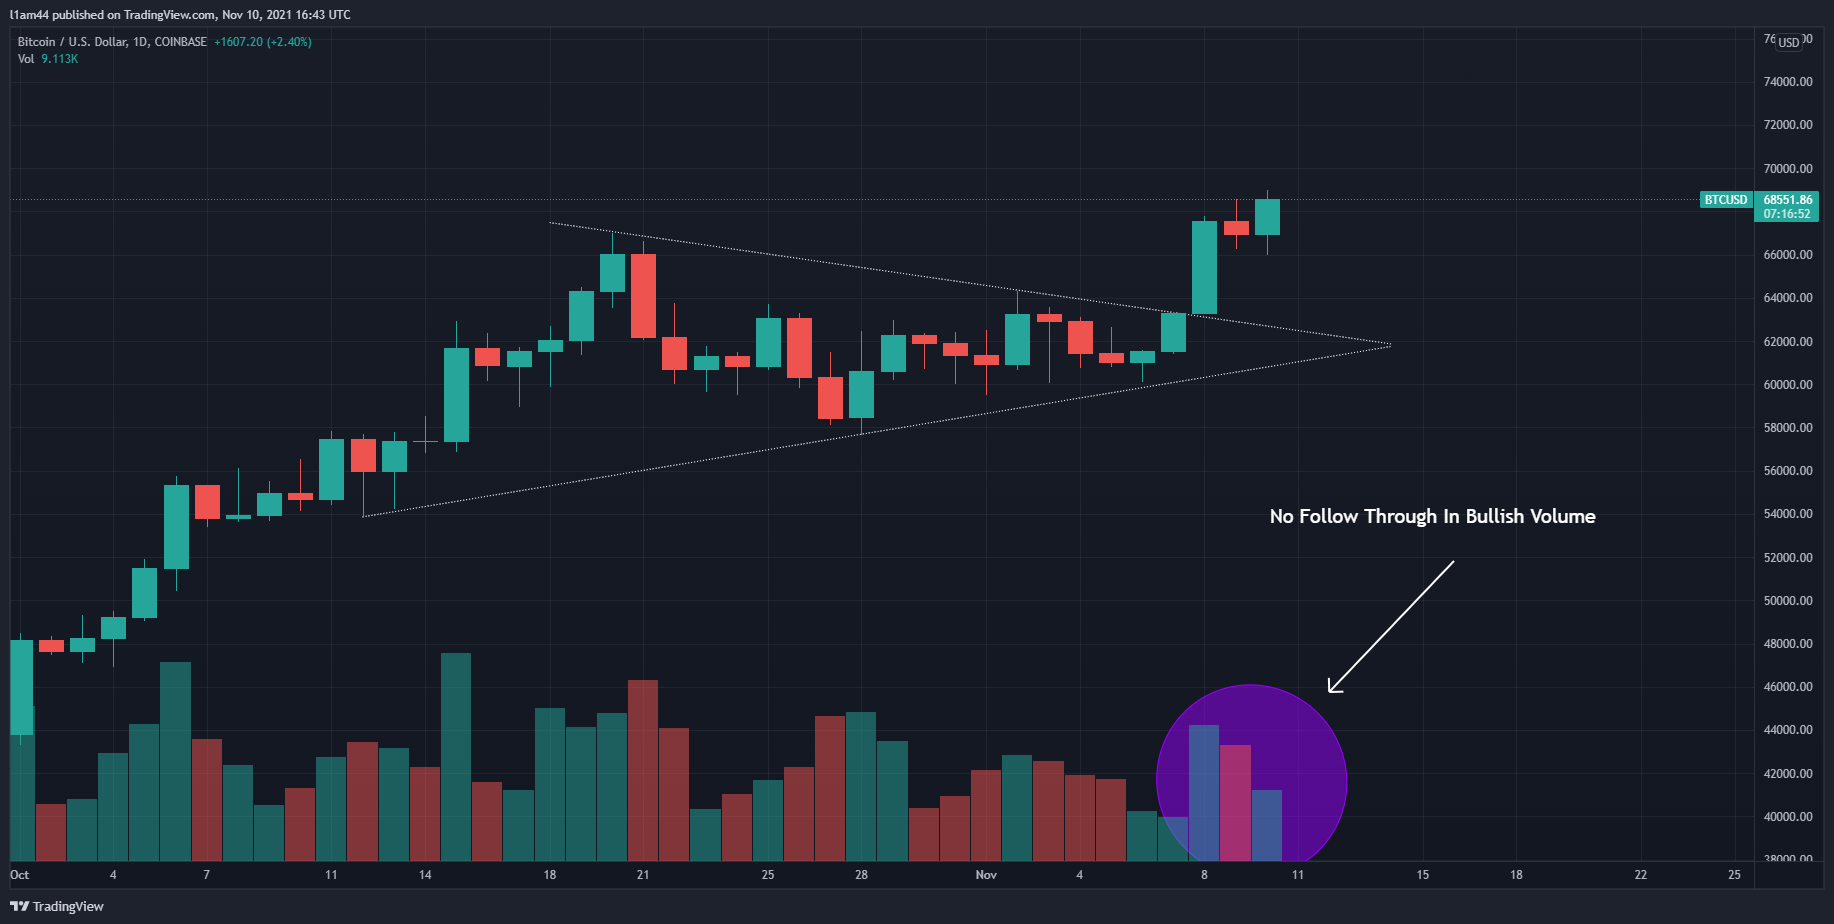
Reducing volume throughout the formation of the Triangle
An increase in volume at the time of the breakout

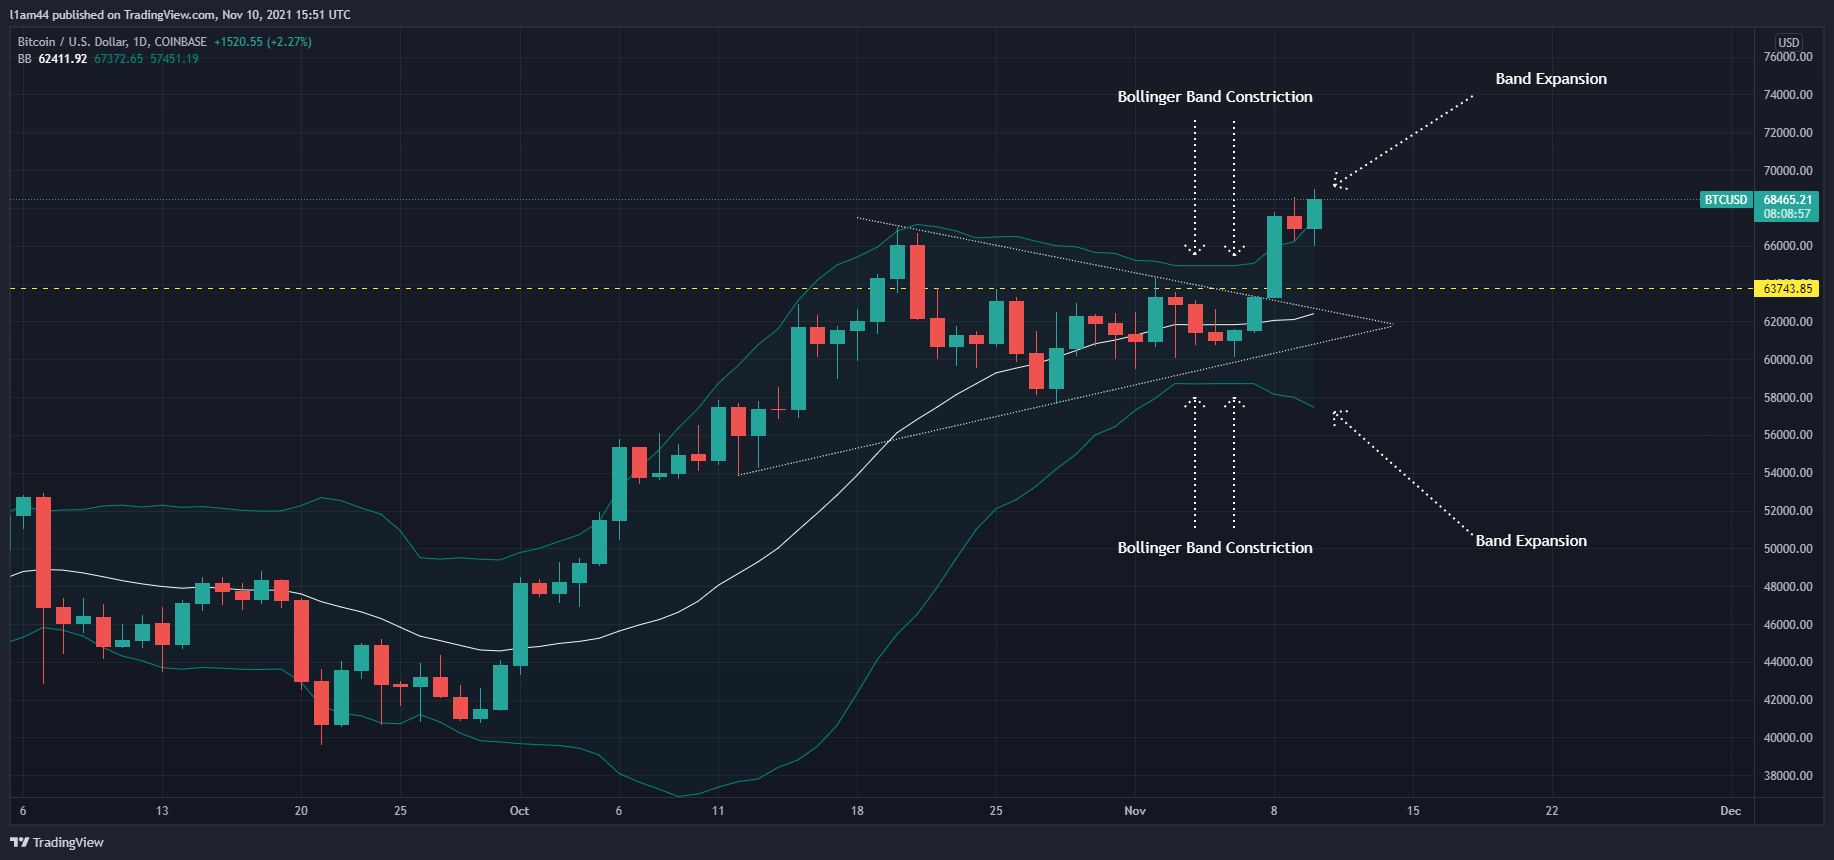
Symmetrical Triangle Volume Analysis - BTC 1D A tightening of the Bollinger Bands (A measure of Volatility)
An expansion of the Bollinger Bands following the breakout
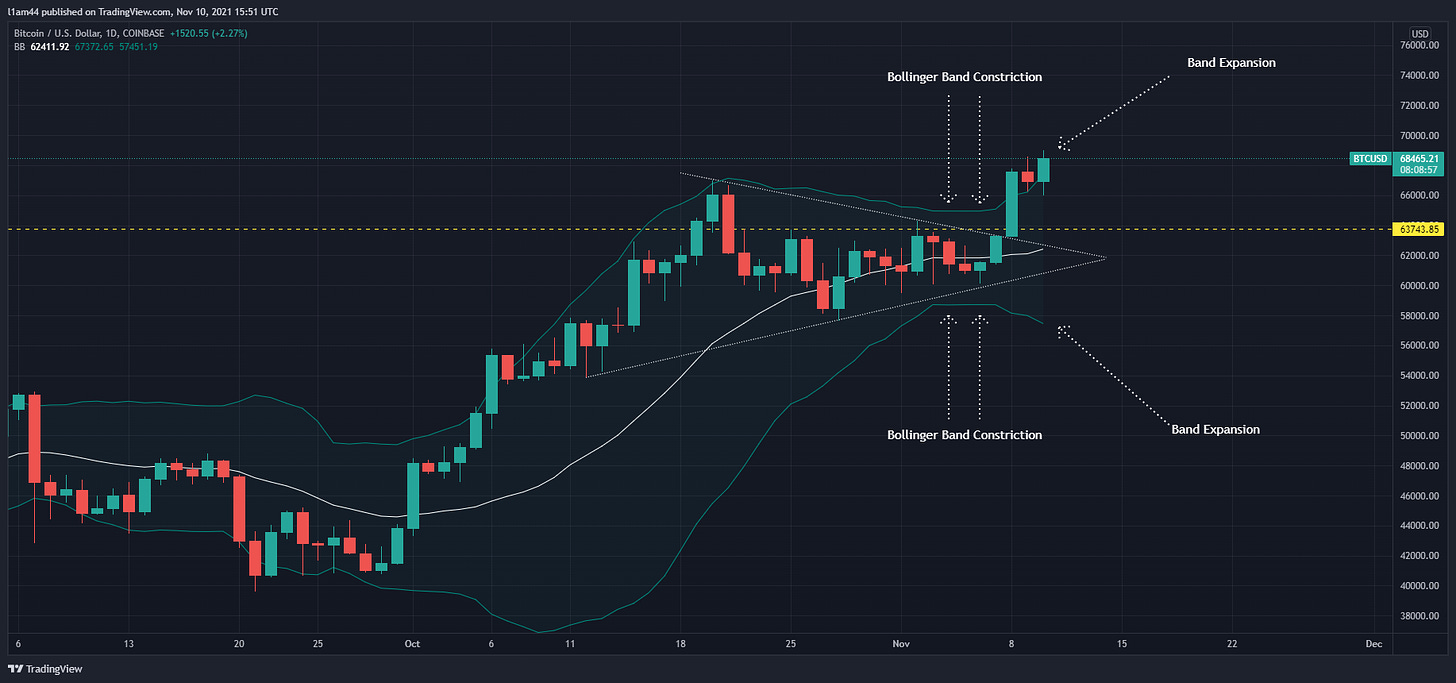
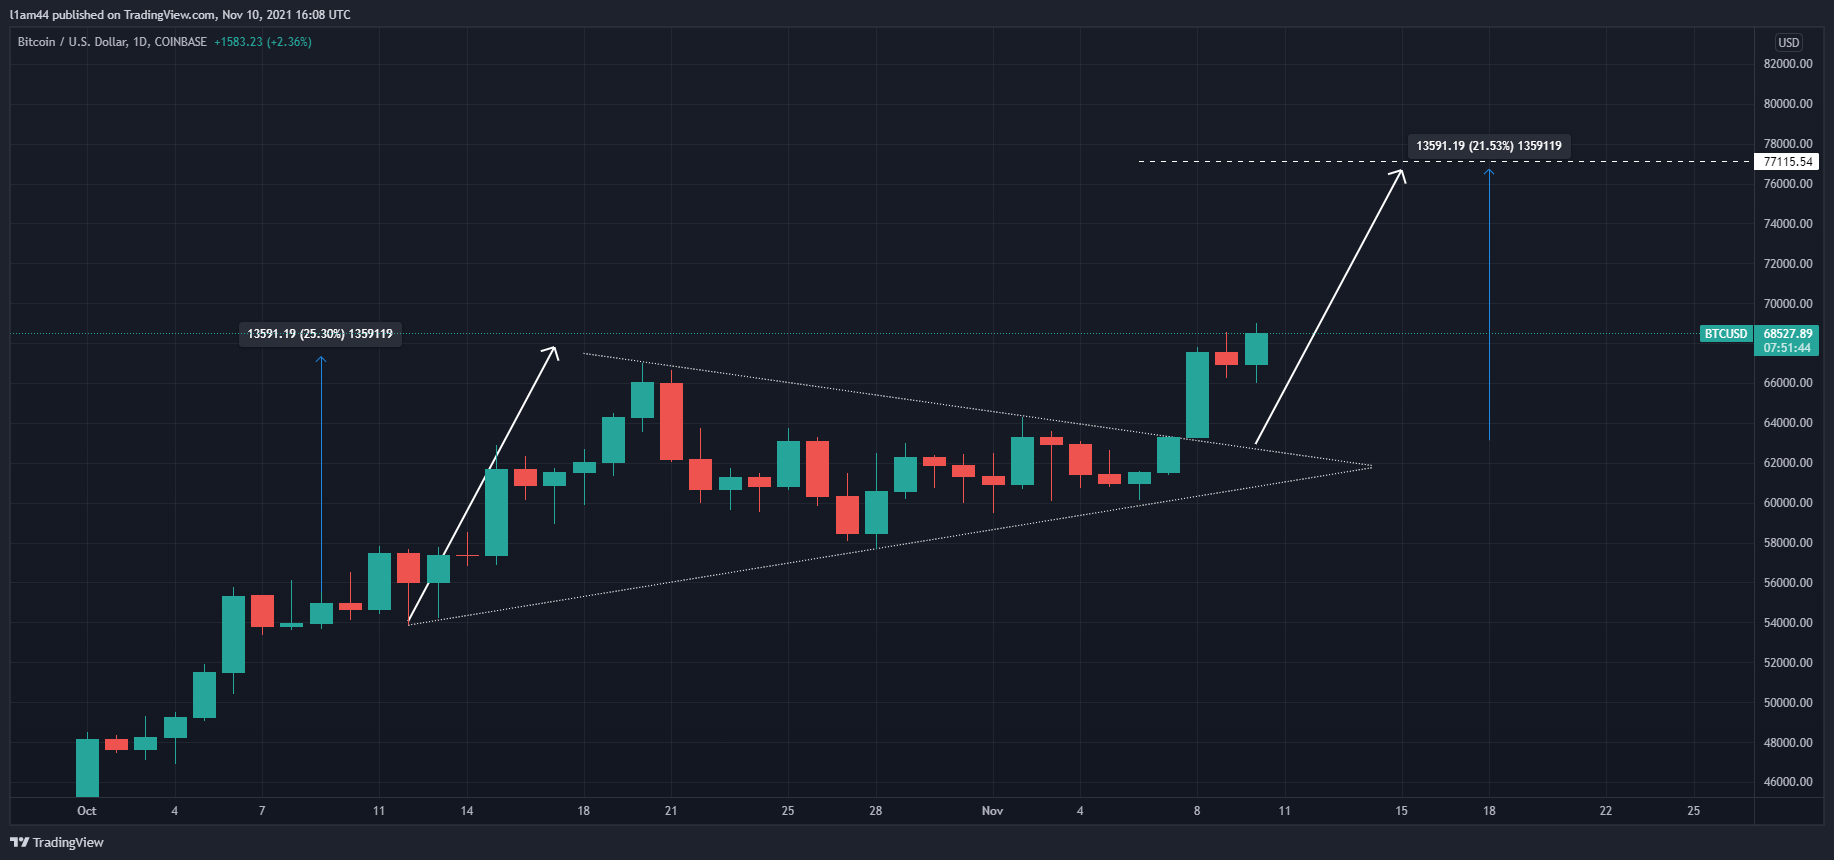
Symmetrical Triangle Bollinger Band Analysis - BTC 1D The width of the Triangle Base is roughly $13,500
A Measured move equal to the Triangle base targets a price of roughly $77,000

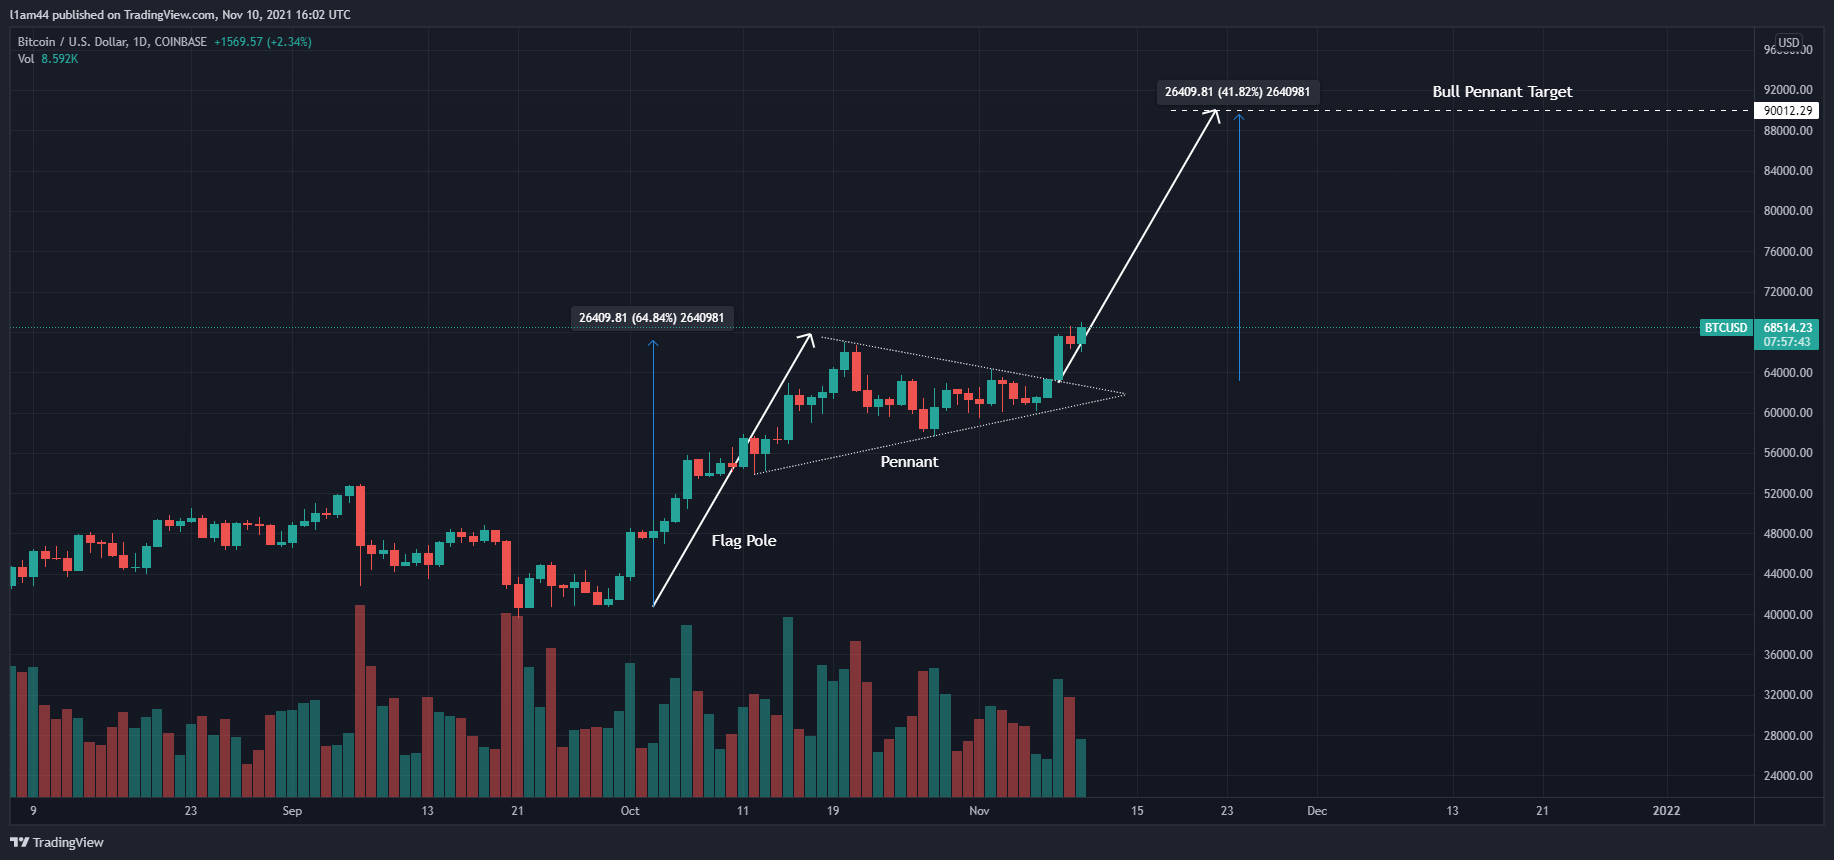
Triangle Breakout Target Price - Bitcoin 1D The triangle is a bullish pennant forming after a bullish move forming the ‘pole’
The size of the flag pole is equal to roughly $26,400 resulting in a target price of roughly $90,000 following the breakout.
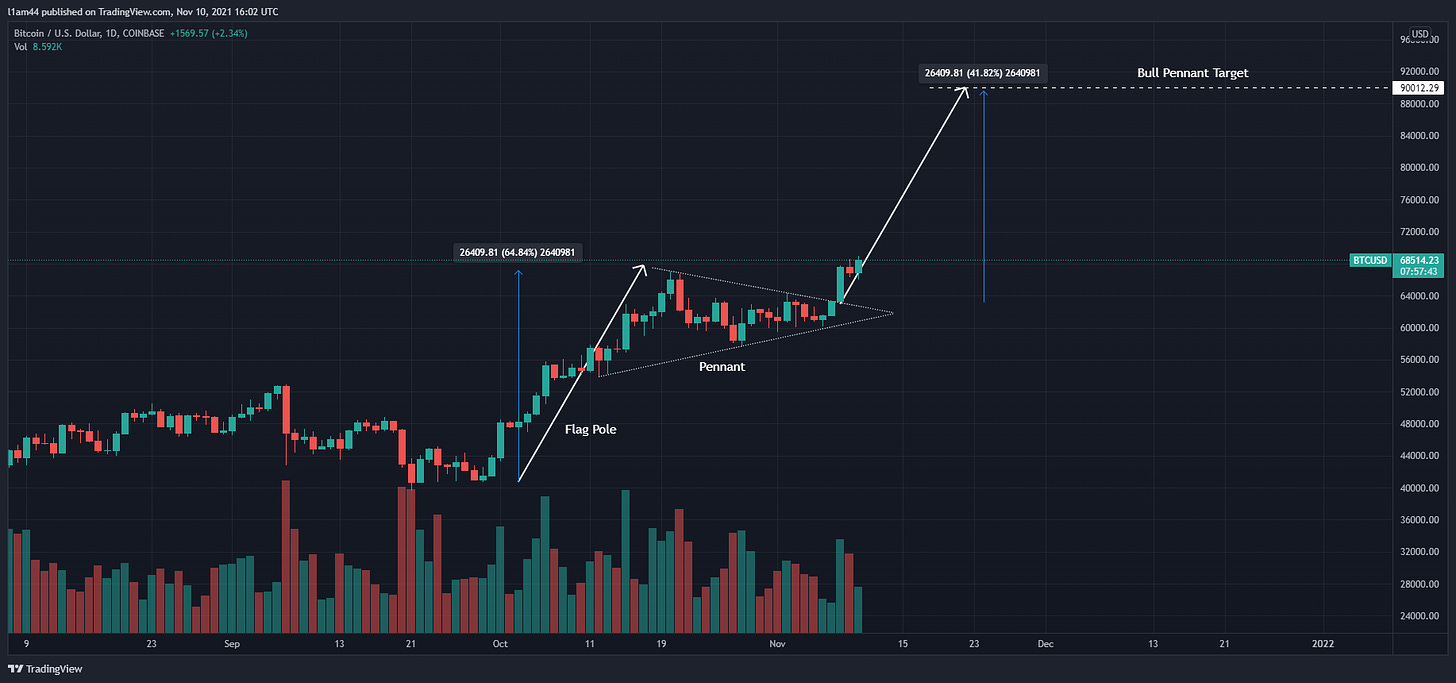
Bullish Pennant Measured Move Target - Bitcoin 1D
The key takeaway from these points is that all the technicals are suggesting this is a genuine breakout. The target prices for this move higher, according to the technicals, are $77,000 for a measured move away from the symmetrical Triangle, and $90,000 for a measured move away from a bullish pennant.
Perhaps the only criticism is that we could see a more convincing follow through of bullish volume following the initial break of the triangle. It would be great to see that bullish volume appear in the coming days of price action.
All of this analysis has been done on the Bitcoin Daily Chart. Whilst other charts my show a different technical picture, the daily chart, exhibiting a western technical pattern, is excellent for mapping out the state of the market in the short-mid term (The next few days/weeks).
Litecoin
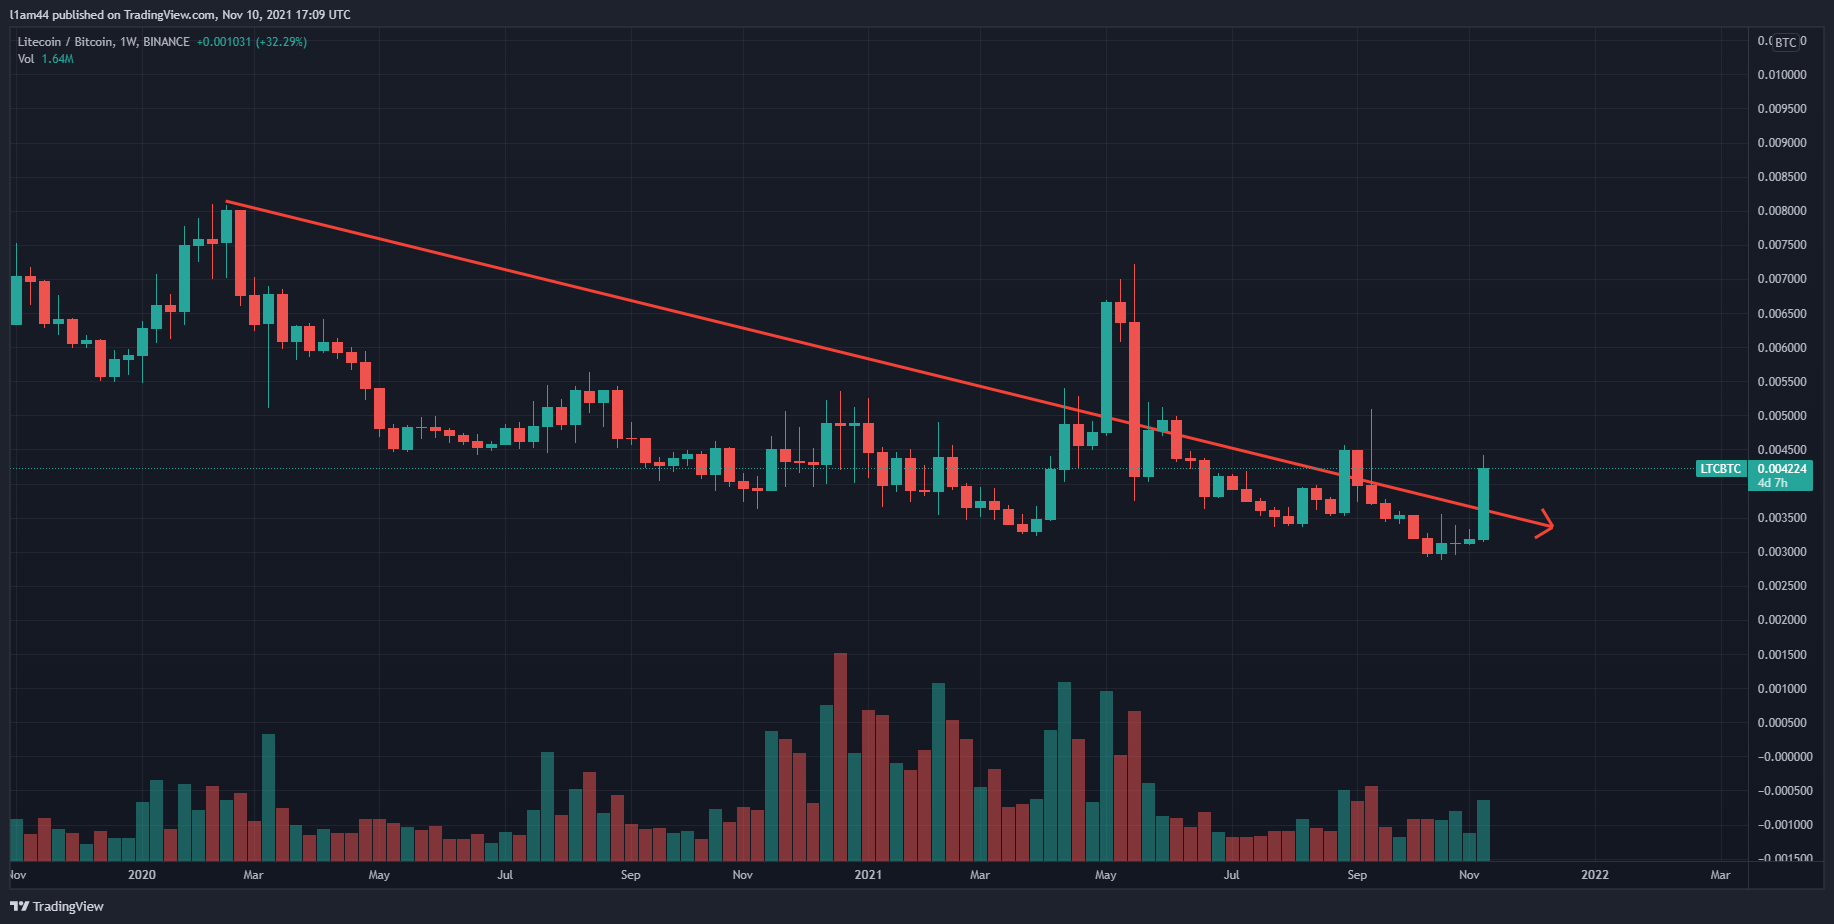
Since the beginning of this week, Litecoin has seen a noticeable increase in volatility, resulting in an increase in value of over 40% in the last 3 days. Whilst this is impressive, it does not signal anything to suggest an overly aggressive and sustained bullish move. However, it is a reminder that perhaps there is still more to come from Litecoin during this bull run.

Generally speaking, Litecoin has underwhelmed in its performance relative to the rest of the market. The Majority of Altcoins have outperformed Litecoin over the past 18 months, many of which that are situated in cutting-edge sectors of the Crypto space such as DeFi and NFTs. Not only this, but even Bitcoin, generally considered to be the least volatile and, therefore, bringing some of the lowest returns during periods of rampant speculation, has outperformed Litecoin in the last 18 months as well.
That said, I have continued to hold my Litecoin position, perhaps wrongly (we will find out in time). I see a possibility for Litecoin to record a substantial increase in price, and fairly rapidly.
Why?
Shiba Inu and Dogecoin have been fantastic examples of how cutting edge, exciting altcoins, with what we consider to be strong fundamentals and superior utility, aren’t always the best performers.
Both Dogecoin and Shiba Inu recorded explosive gains and in relatively quick periods of time, and both now hold a place as one of the top 10 largest Cryptocurrencies by Market Capitalisation, if you exclude Stablecoins (Source: Coingecko).
These speculative rallies occur and even sustain in periods of excessive bullish sentiment. Although Litecoin does not have the meme culture community to rally behind it, it’s simplicity as an alternative peer-to-peer payment network instead of Bitcoin can create an easy-to-understand narrative to validate a speculative rally, should it occur. ‘Litecoin is the Silver to Bitcoin’s Gold.’
Putting aside narratives and fundamentals, which ultimately Litecoin is currently lacking in the eyes of investors and speculators alike, let us turn our attention to some interesting technicals.
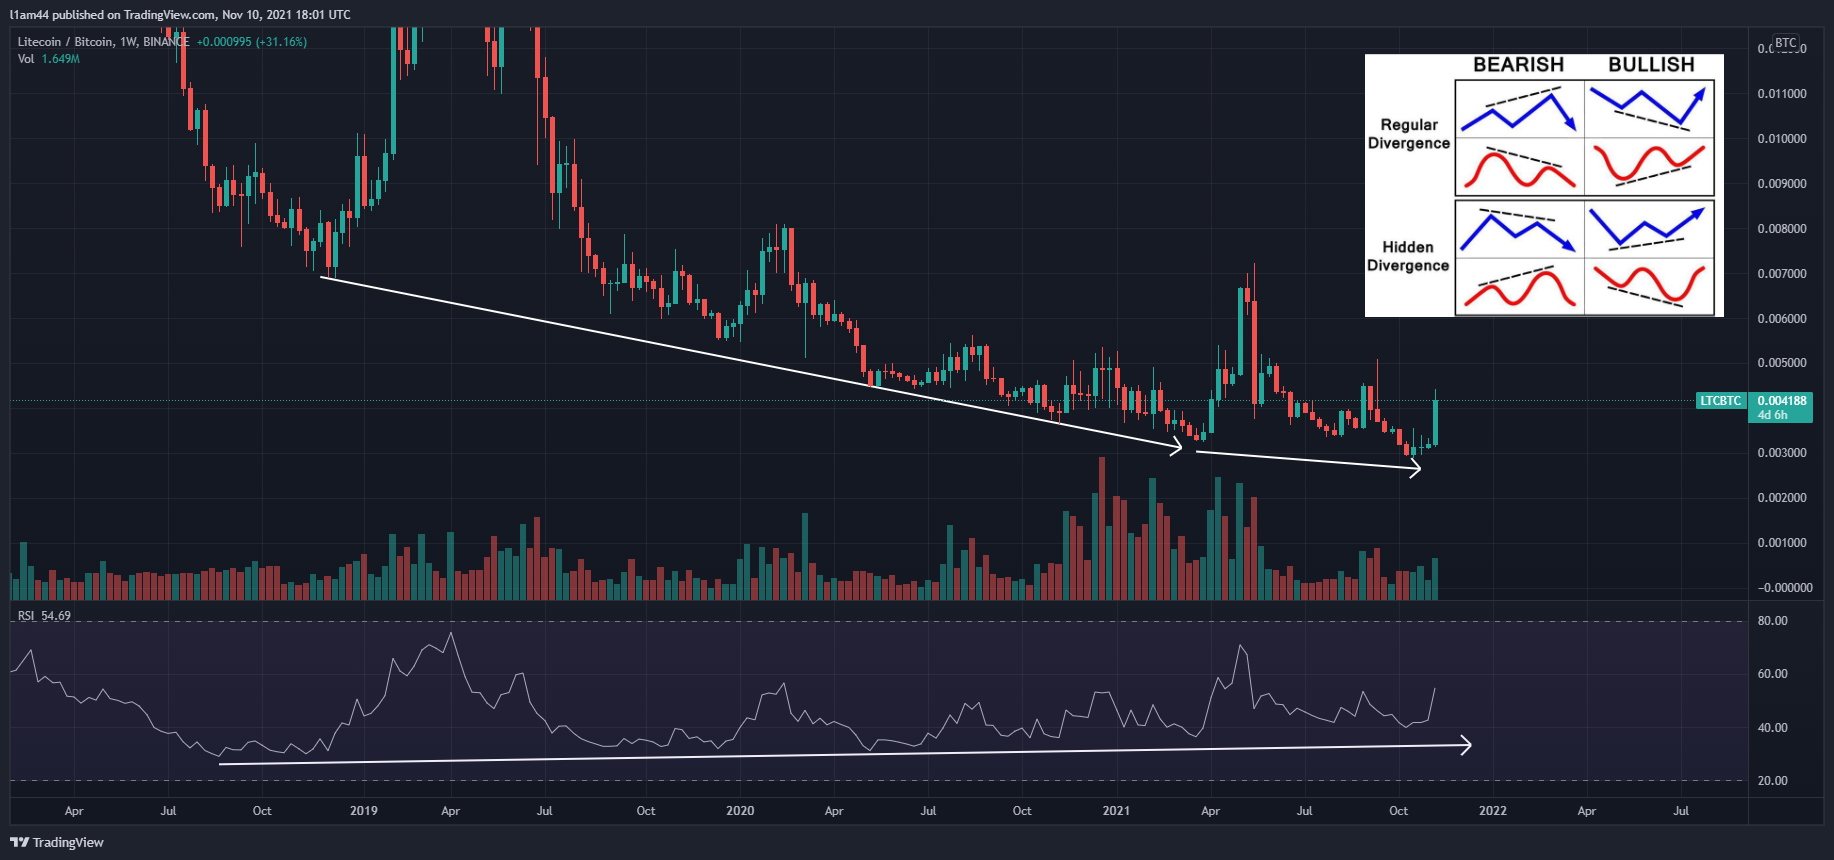
The technical element that fascinates me the most for Litecoin is visible on the LTC/BTC pair, on the weekly chart (as seen above). Comparing the respective lows of the value of Litecoin to the lows of the Relative Strength Index indicator, we see a divergence that has lasted over 3 years.
Litecoin, relative to Bitcoin, has continued to set lower lows in valuation. Simultaneously, the RSI has continued to set higher lows. This divergence is considered to be bullish, and a significant price or trend reversal would confirm this.
The volatility seen from Litecoin over the past 3 days is represented by only the furthest green candle to the right in this chart. The volatility we are currently seeing is not anything significant, however, should we see more significant volatility in the near future, we can say that this chart would be a good case for an explosive price appreciation for Litecoin relative to Bitcoin.
But, until then, there is little to talk about. Keep Litecoin on your radar perhaps, but as mentioned before, this one continues to underperform, until it doesn’t... Maybe.
A Healthy Altcoin Market
A perhaps obvious takeaway from today’s analysis is that the market is overall very healthy. A healthy Bitcoin often leads to a healthy Altcoin market, and we can see that with some of the less innovative sectors making sizable moves (such as Litecoin - Sizable, but perhaps not significant as previously discussed).
I personally remain bullish on both Altcoins and Bitcoin. I also believe that the market health we are seeing suggests that we are still to see another Altcoin cycle, before any major corrections, let’s see if I am correct.
Disclaimer: This newsletter is for educational purposes only and is not to be mistaken for direct financial advice. Always consult a certified financial advisor regarding investment decisions.
Thank you so much for reading, and I hope this analysis was insightful. Apologies for the delay in the newsletter release. See you all next week.
Consider sharing with friends to spread the message. Subscribe for free to support, with optional paid membership. See you soon.